
Published
5 years ago on
April 18, 2019
Bitcoin
Bitcoin (BTC/USD) extended its recent depreciation as traders drove the pair to the 4901.99 level during today’s Asian session, the pair’s weakest showing since 5 April. Today’s intraday Low was just below the 4911.81 level, representing the 23.6% retracement of the move from 5345.00 to 4778.00 and a level we have spotlighted.
Some intraday Support emerged yesterday when Bears challenged the 4969.45 area, representing the 50% retracement of the 6810.00 – 3128.89 range and a key technical level we have repeatedly highlighted.
The 50-bar MA (4-hourly) also proved to be challenging technical Resistance during yesterday’s European and North American sessions, keeping the pair offered below the 5096.36 level.
Technicians are eyeing additional technical Support around the 4738.23 level, representing the 23.6% retracement of the move from 9948.12 to 3128.89.
Price activity is nearest the 50-bar MA (4-hourly) at 5103.36 and the 200-bar MA (Hourly) at 5107.02.
Technical Support is expected around 4877.05/ 4582.91/ 4393.64 with Stops expected below.
Technical Resistance is expected around 5264.14/ 5403.82/ 5769.98 with Stops expected above.
On 4-Hourly chart, SlowK Bullishly moved above SlowD while MACD remains Bearishly below MACDAverage.
On 60-minute chart, SlowK remains Bullishly above SlowD while MACD remains Bullishly above MACDAverage.
Ethereum
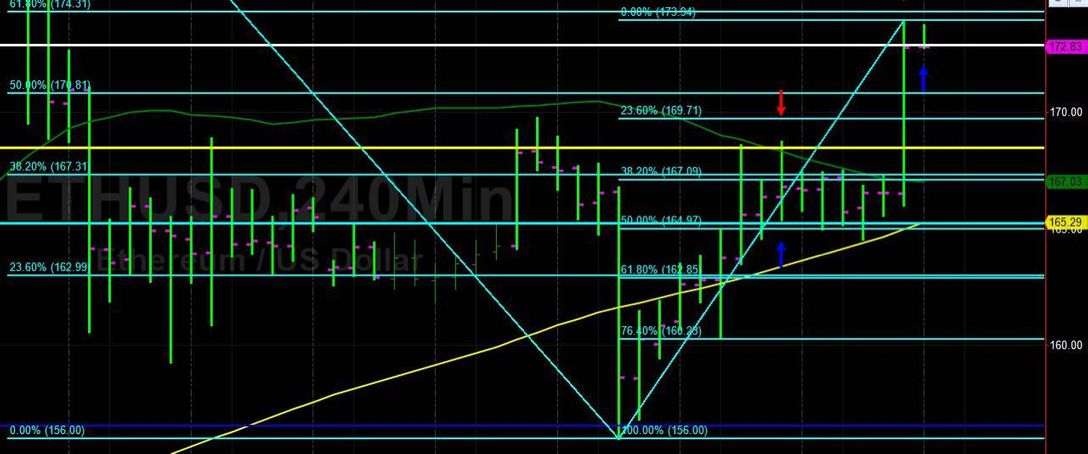
Ethereum (ETH/USD) remained on the defensive during today’s Asian session as traders drove the pair as Low as the 159.27 area, its weakest print since 5 April. Minor Stops were reached below the 159.78 area, representing the 23.6% retracement of the 180.10 – 153.50 range. As we noted in our 11 April 2019 analysis, a Double Top chart pattern is now evident on a 4-hourly chart. Traders are technically curious to see how price activity develops down to the 150.52 area.
The 156.53 level is a major downside focal point for traders, representing the 23.6% of the 80.60 – 179.98 range.
Price activity is nearest the 50-bar MA (4-hourly) at 169.91 and the 200-bar MA (Hourly) at 170.33.
Technical Support is expected around the 152.41/ 144.09/ 130.29 levels with Stops expected below.
Technical Resistance is expected around the 169.34/ 172.45/ 175.55 levels with Stops expected above.
On 4-Hourly chart, SlowK is Bullishly above SlowD while MACD is Bearishly below MACDAverage.
On 60-minute chart, SlowK remains Bearishly below SlowD while MACD remains Bullishly above MACDAverage.
Litecoin
Litecoin (LTC/USD) remained rangebound following its recent descent as traders took the pair as low as the 75.44 area during the Asian session. Today’s intraday low was right around the 50% retracement of the 127.95 – 22.17 range, and traders are eyeing some Stops below the 75.06 area.
The 86.08 area emerged as technical Resistance during yesterday’s European session, right around the 50-bar MA (4-hourly). Chartists are now eyeing the 74.19 area, representing the 100-bar MA (4-hourly).
Price activity is nearest the 100-bar MA (4-hourly) at 74.19 and the 50-bar MA (Hourly) at 83.54.
Technical Support is expected around the 72.10/ 67.17/ 65.60 levels with Stops expected below.
Technical Resistance is expected around the 83.94/ 92.56/ 102.26 levels with Stops expected above.
On 4-Hourly chart, SlowK is Bearishly below SlowD while MACD is Bearishly below MACDAverage.
On 60-minute chart, SlowK remains Bullishly above SlowD while MACD remains Bullishly above MACDAverage.
Bitcoin Cash
BCH/USD (Bitcoin Cash/ US dollar) remained pressured during today’s Asian session as traders pushed the pair lower to the 258.37 level. Price activity continues to orbit the 265.55 level, representing the 23.6% retracement of the 888.19 – 73.22 range.
Chartists are eyeing the 211.46 level as an important area, and the 100-bar MA (232.93) on a 4-hourly chart is also technically relevant.
Price activity is nearest the 100-bar MA (4-hourly) at 232.93 and the 50-bar MA (Hourly) at 285.41.
Technical Support is expected around the 229.49/ 206.64/ 186.06 levels with Stops below.
Technical Resistance is expected around the 280.70/ 294.74/ 306.09 levels with Stops above.
On 4-Hourly chart, SlowK remains Bearishly below SlowD while MACD remains Bearishly below MACDAverage.
On 60-minute chart, SlowK is Bullishly above SlowD while MACD remains Bullishly above MACDAverage.
Investment Disclaimer


