Published
4 years ago on
April 26, 2019
Bitcoin
Bitcoin (BTC/USD) managed to reclaim a little bit of lost ground in today’s Asian session as traders continued to lift the pair from yesterday’s intraday low of 4963.00 following the sharp and rapid sell-off. Traders pushed the pair higher to the 5295.03 level during the Asian session before some profit-taking emerged and technical accounts probed demand around some key levels that we have highlighted for weeks.
The rapid plunge during yesterday’s North American session started when the pair tested the 5512.12 level, around the 50% retracement of the move from 5650.01 to 5374.00. Chunky Stops were triggered during the descent, including below the 5316.39 area, representing the 76.4% retracement of the 5213.34 – 5650.01 range. Solid Bids emerged around the 4969.45 area, a level we have discussed that represents the 50% retracement of the 6810.00 – 3128.89 range. Thereafter, some decent demand was seen around the 5078.52 area, driving BTC/USD back to the 100-bar MA (4-hourly) around 5176.07, an extremely important level that we continue to cite.
Any additional weakness may see some Stops challenged below the 4901.99 area and they could give way down to the 4761.41 level.
Price activity is nearest the 100-bar MA (4-hourly) at 5244.56 and the 200-bar MA (Hourly) at 5354.20.
Technical Support is expected around 4901.99/ 4764.41/ 4394.64 with Stops expected below.
Technical Resistance is expected around 5769.98/ 5941.26/ 6393.93 with Stops expected above.
On 4-Hourly chart, SlowK is Bullishly above SlowD while MACD is Bearishly below MACDAverage.
On 60-minute chart, SlowK is Bullishly above SlowD while MACD is Bearishly below MACDAverage.
Ethereum
Ethereum (ETH/USD) gained a little bit of lost ground during today’s Asian session as the pair got back to the 156.00 figure after trading as low as the 146.00 area during yesterday’s North American session. During yesterday’s plunge, Stops were elected below the 158.71 area, the 200-bar MA (4-hourly) and this hastened the slide to another area of Stops below the 151.69 area, representing the 50% retracement of the 222.78 – 80.60 range.
On the upside, ETH/USD will need to contend with the 156.53 level and then with some new technical Resistance around the 157.82/ 161.47 areas that are related to the depreciation from 176.94 to 146.00. Additional selling pressure may emerge around the 165.12 and 169.64 areas.
Price activity is nearest the 200-bar MA (4-hourly) at 158.88 and the 50-bar MA (Hourly) at 162.86.
Technical Support is expected around the 146.74/ 137.61/ 132.90 levels with Stops expected below.
Technical Resistance is expected around the 161.47/ 165.12/ 169.64 levels with Stops expected above.
On 4-Hourly chart, SlowK is Bullishly above SlowD while MACD is Bearlishly below MACDAverage.
On 60-minute chart, SlowK is Bullishly above SlowD while MACD is Bearishly below MACDAverage.
Litecoin
Litecoin (LTC/USD) found some demand during today’s Asian session as traders lifted the pair back to the 73.50 level following yesterday’s steep plunge to the 68.88 area. The 75.06 area has been toppish in recent sessions, representing the 50.0% retracement of the 127.95 – 22.17 range, and the pair has also been challenged by the 200-bar MA (4-hourly), currently around the 74.66 area.
Chartists are waiting to see how the pair behaves around the 74.62 and 72.42 areas, levels the pair will need to absorb on a move higher if it will again challenge the technically-relevant 76.39 area that we have written about extensively.
Price activity is nearest the 200-bar MA (4-hourly) at 74.66 and the 50-bar MA (Hourly) at 72.76.
Technical Support is expected around the 67.17/ 62.62/ 55.35 levels with Stops expected below.
Technical Resistance is expected around the 78.58/ 81.13/ 87.39 levels with Stops expected above.
On 4-Hourly chart, SlowK is Bearishly below SlowD while MACD is Bearishly below MACDAverage.
On 60-minute chart, SlowK is Bullishly above SlowD while MACD is Bearishly below MACDAverage.
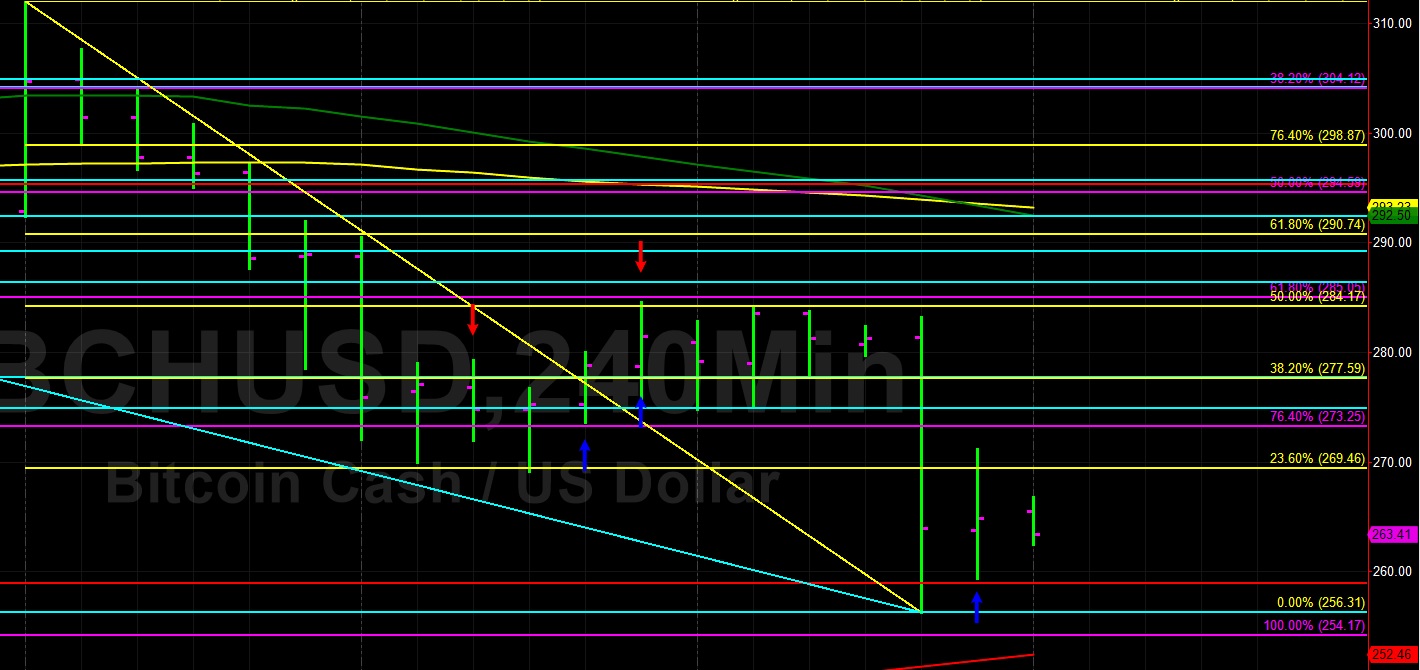
Bitcoin Cash
BCH/USD (Bitcoin Cash/ US dollar) encountered some upward price pressure during today’s Asian session as the pair tested Offers around the 271.20 area after trading as low as the 256.31 area during yesterday’s North American session. Major Stops were elected below the 271.35 level yesterday, representing the 38.2% retracement of the move from 591.88 to 73.22, an area that has been toppish since the sharp move lower.
New areas of technical Resistance include the 269.46/ 277.59 areas and chartists are also eyeing Stops above the 284.17 level. Additionally, the 286.36/ 295.66 areas now represent additional levels of technical Resistance.
Price activity is nearest the 200-bar MA (4-hourly) at 252.47 and the 50-bar MA (Hourly) at 276.29.
Technical Support is expected around the 254.17/ 232.10/ 211.46 levels with Stops below.
Technical Resistance is expected around the 284.17/ 295.64/ 314.12 levels with Stops above.
On 4-Hourly chart, SlowK is Bearishly below SlowD while MACD is Bearishly below MACDAverage.
On 60-minute chart, SlowK is Bearishly below SlowD while MACD is Bearishly below MACDAverage.
Investment Disclaimer