Published
4 years ago on
April 29, 2019
Bitcoin
Bitcoin (BTC/USD) encountered some buying pressure early in today’s Asian session as the pair climbed higher to the 5172.26 area after trading as low as the 5101.00 figure during yesterday’s North American session. Price activity continues to swirl around the technically-relevant 5176.07 area, representing the 38.2% retracement of the move from 8488.00 to 3128.89. Another key level that the pair has been unable to breach in recent days is the 5225.44 level, representing the 38.2% retracement of the 5650.01 – 4963.00 range.
BTC/USD will also need to contend with the 100-bar MA (4-hourly) on a move higher, currently around the 5243.49 area, followed by the 50-bar MA (4-hourly) which is now around 5312.02. On the downside, chartists are interested to see if BTC/USD can remain Bid around the 5078.52 area, representing the 76.4% retracement of the move from 4901.99 to 5650.01. Below that area, the 200-bar MA (4-hourly) is now around 4937.64.
Price activity is nearest the 100-bar MA (4-hourly) at 5243.49 and the 50-bar MA (Hourly) at 5167.68.
Technical Support is expected around 4901.99/ 4764.41/ 4394.64 with Stops expected below.
Technical Resistance is expected around 5769.98/ 5941.26/ 6393.93 with Stops expected above.
On 4-Hourly chart, SlowK is Bearishly below SlowD while MACD is Bullishly above MACDAverage.
On 60-minute chart, SlowK is Bullishly above SlowD while MACD is Bearishly below MACDAverage.
Ethereum
Ethereum (ETH/USD) was pressured early in today’s Asian session after the pair moved lower to the 152.16 area during yesterday’s North American session and was unable to get above the 154.44 level during the rebound higher. The pair has orbited the 153.30 level since 25 April, representing the 23.6% retracement of the move from 176.94 to 146.00.
Chartists are eager to see if the pair can remain above the 151.69 area, another important level that represents the 50% retracement of the move from 222.78 to 80.60. A break below this level will again spotlight the 146.74 area, representing the 38.2% retracement of the move from 80.60 to 187.62.
On the upside, the pair would need to challenge technical Resistance around the 157.82 area, representing the 38.2% retracement of the aforementioned 176.94 – 146.00 range, followed by the 200-bar MA (4-hourly) and 50-bar MA (4-hourly).
Price activity is nearest the 200-bar MA (4-hourly) at 160.44 and the 50-bar MA (Hourly) at 154.60.
Technical Support is expected around the 146.74/ 137.61/ 132.90 levels with Stops expected below.
Technical Resistance is expected around the 161.47/ 165.12/ 172.88 levels with Stops expected above.
On 4-Hourly chart, SlowK is Bearishly below SlowD while MACD is Bullishly above MACDAverage.
On 60-minute chart, SlowK is Bullishly above SlowD while MACD is Bearishly below MACDAverage.
Litecoin
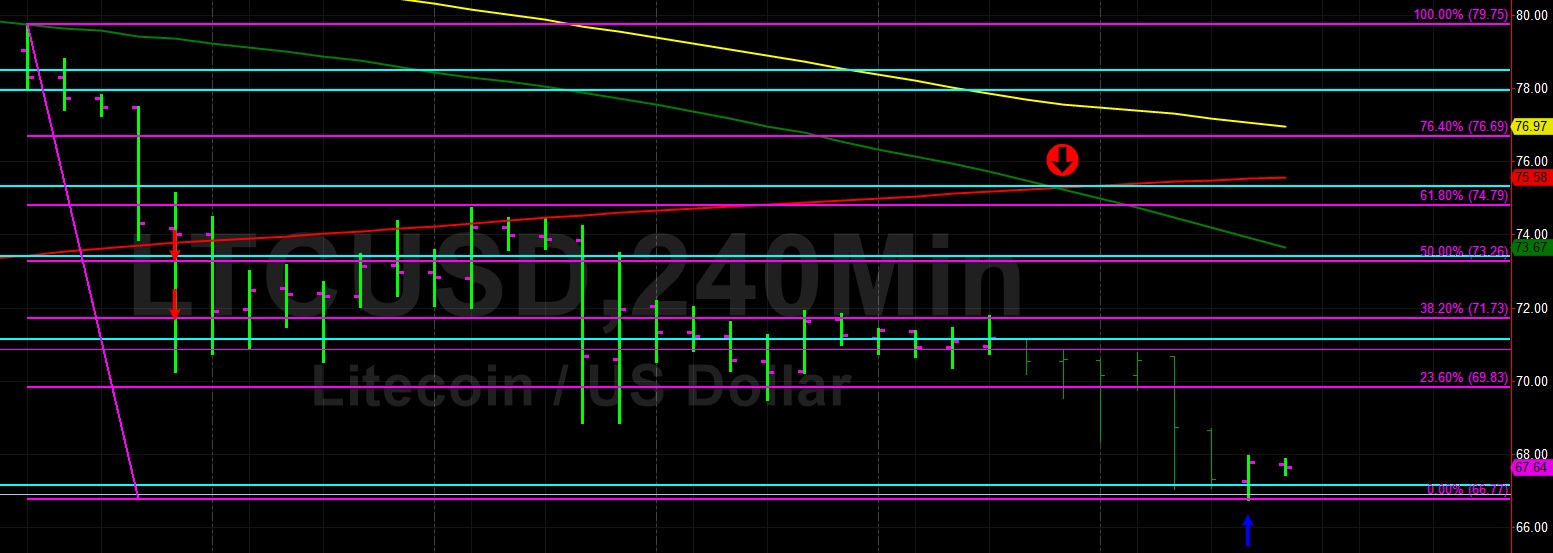
Litecoin (LTC/USD) searched for a bottom during today’s Asian session as the pair continued to depreciate following its descent during yesterday’s European and North American sessions, eventually reaching a low around the 66.77 area overnight. As we have predicted in recent analyses, major Stops were in place below the 68.88 area and were elected during yesterday’s downturn. This drove the pair to its lowest level since 2 April 2019. The pair has only managed to get as high as the 67.95 area during the brief move higher.
Additional LTC/USD weakness will spotlight additional downside technical levels including 65.60 followed by 62.68/ 61.03/ 59.97/ 58.28. Given the pair’s recent bearishness, some chartists are anticipating additional selling pressure below current levels and such pressure could open up the 51.38/ 49.01/ 45.81 areas.
Price activity is nearest the 50-bar MA (4-hourly) at 73.67 and the 50-bar MA (Hourly) at 69.98.
Technical Support is expected around the 65.60/ 62.62/ 55.35 levels with Stops expected below.
Technical Resistance is expected around the 72.16/ 78.58/ 81.13 levels with Stops expected above.
On 4-Hourly chart, SlowK is Bearishly below SlowD while MACD is Bearishly below MACDAverage.
On 60-minute chart, SlowK is Bullishly above SlowD while MACD is Bearishly below MACDAverage.
Bitcoin Cash
BCH/USD (Bitcoin Cash/ US dollar) continued to weaken during today’s Asian session as the pair was challenged around the 250.30 level during a short-lived pullback and then came off to the 246.69 area. During yesterday’s North American session, the pair weakened to the 244.00 figure after some decent Stops were hit below the psychologically-important 250.00 figure, driving the pair to its weakest print since 3 April 2019.
During yesterday’s North American session, the pair saw its first 4-hourly bar close below the 200-bar MA since 13 March 2019. Technicians note that there does not appear to be too much in the way of technical Support for BCH/USD all the way down to 232.10.
On the upside, some new technical Resistance levels to watch include 260.05/ 265.49/ 272.69.
Price activity is nearest the 200-bar MA (4-hourly) at 260.48 and the 50-bar MA (Hourly) at 257.42.
Technical Support is expected around the 232.10/ 211.46/ 202.06 levels with Stops below.
Technical Resistance is expected around the 267.27/ 273.69/ 284.17 levels with Stops above.
On 4-Hourly chart, SlowK is Bearishly below SlowD while MACD is Bearishly below MACDAverage.
On 60-minute chart, SlowK is Bearishly below SlowD while MACD is Bearishly below MACDAverage.
Investment Disclaimer