Published
5 years ago on
April 15, 2019
Bitcoin
Bitcoin (BTC/USD) scored strong gains during today’s Asian session, rocketing to the 5191.19 level. In our 14 April 2019 analysis, we identified the 50-bar MA (4-hourly) as technical Resistance and strong Stops were elected above the 5137.67 area after traders tested this key area. The pair reached the 5191.19 level, just below the 50% retracement of the 5488.00 – 4901.99 range. Additional Stops were elected above the 5125.85 area, representing the 38.2% retracement of the same range.
Notably, there were some early indications during the Asian session that BTC/USD was trying to derive technical Support at the 50-bar MA (4-hourly), a development that could see a test of the 5264.14/ 5349.70 levels.
Another major upside target is 5403.82, representing the 61.8% retracement of the 6810.00 – 3128.89 range.
Price activity is nearest the 50-bar MA (4-hourly) at 5140.40 and the 200-bar MA (Hourly) at 5136.80.
Technical Support is expected around 4877.05/ 4582.91/ 4393.64 with Stops expected below.
Technical Resistance is expected around 5264.14/ 5403.82/ 5769.98 with Stops expected above.
On 4-Hourly chart, SlowK is Bullishly above SlowD while MACD is Bullishly above MACDAverage.
On 60-minute chart, SlowK is Bullishly above SlowD while MACD is Bullishly above MACDAverage.
Ethereum
Ethereum (ETH/USD) encountered decent buying pressure during today’s Asian session, reaching as high as the 169.76 level. As noted in our 14 April 2019 analysis, traders gunned for the Stops above the 169.34 area, representing the 38.2% retracement of the 185.62 – 159.27 area. Stops were also triggered above the 168.47 area, representing the 61.8% retracement of the 222.78 – 80.60 range. This technical breach opens up the 189.23 level as an upside target, representing the 76.4% retracement of the same range.
Traders are curious if ETH/USD will have the strength to test the 50-bar MA (4-hourly), currently around the 170.33 area. Stops are likely situated above, and a break would likely see the 172.45 area tested.
Price activity is nearest the 50-bar MA (4-hourly) at 170.33 and the 200-bar MA (Hourly) at 170.37.
Technical Support is expected around the 161.43/ 152.41/ 144.09 levels with Stops expected below.
Technical Resistance is expected around the 179.40/ 185.62/ 214.08 levels with Stops expected above.
On 4-Hourly chart, SlowK is Bullishly above SlowD while MACD is Bullishly above MACDAverage.
On 60-minute chart, SlowK is Bearishly below SlowD while MACD is Bullishly above MACDAverage.
Litecoin
Litecoin (LTC/USD) appreciated sharply during today’s Asian session as the pair traded as high as the 84.73 level, its strongest showing since 11 April. We spotlighted the 84.71 level in our 14 April 2019 analysis as a key upside price target. Many key levels were tested during the ascent, including the 83.97 area, representing the 76.4% retracement of the 103.06 – 22.17 area. Minor Stops were also triggered above the 84.28 area, representing the 50-bar MA (4-hourly). The 86.61/ 89.27/ 92.56 areas represent upside price objectives.
Stronger upside targets include the 87.39 level, representing the 38.2% retracement of the 192.89 – 22.17 range, and the 102.26 area, representing the 50% retracement of the 182.35 – 22.17 range.
Price activity is nearest the 50-bar MA (4-hourly) at 84.28 and the 200-bar MA (Hourly) at 84.31.
Technical Support is expected around the 77.53/ 72.10/ 67.17 levels with Stops expected below.
Technical Resistance is expected around the 92.56/ 102.26/ 107.53 levels with Stops expected above.
On 4-Hourly chart, SlowK is Bullishly above SlowD while MACD is Bullishly above MACDAverage.
On 60-minute chart, SlowK is Bearishly below SlowD while MACD is Bullishly above MACDAverage.
Bitcoin Cash
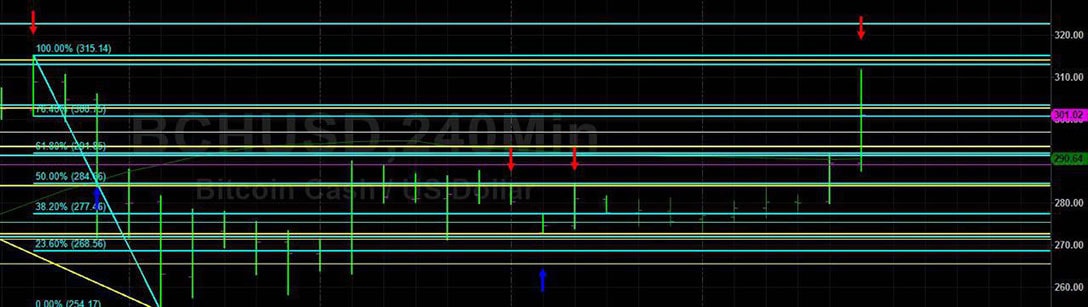
BCH/USD (Bitcoin Cash/ US dollar) exploded higher during today’s Asian session, trading as high as the 311.66 area. Stops were reached above the 289.18 area, representing the 38.2% retracement of the 638.55 – 73.22 range and an important area that we identified in our 14 April 2019 analysis.
A flurry of additional Stops were also triggered above the 293.41 and 302.66 areas, representing the 50% and 61.8% retracement levels of the 332.64 – 254.17 range. The 50-bar MA (4-hourly) provided some brief Resistance for BCH/USD during today’s ascent around the 290.49 area, but this was easily absorbed.
Price activity is nearest the 50-bar MA (4-hourly) at 290.66 and the 50-bar MA (Hourly) at 280.80.
Technical Support is expected around the 277.46/ 265.55/ 254.17 levels with Stops below.
Technical Resistance is expected around the 322.78/ 332.55/ 349.99 levels with Stops above.
On 4-Hourly chart, SlowK is Bullishly above SlowD while MACD is Bullishly above MACDAverage.
On 60-minute chart, SlowK is Bearishly below SlowD while MACD is Bullishly above MACDAverage.
Investment Disclaimer