Published
4 years ago on
May 07, 2019
Bitcoin (BTC) is attempting to break the biggest resistance zone that stands between it and its next bull run. The irony is that majority of the traders that expected this level to hold as support and to never break are now expecting it to be broken in one go as the price is ready to test it as resistance. This speaks volumes about the stage we are currently at. It shows that the market has yet to inflict maximum pain and that we are definitely due for further downside before any trend reversal occurs. Let’s face it, if BTC/USD were to rise above the $5,800-$6,000 resistance zone and break out towards $8,000 that would mark a trend reversal. Considering that we have not seen the trend reverse when the majority is this optimistic and considering that every market cycle in the history of Bitcoin (BTC) is longer than the previous one, we should expect further downside.
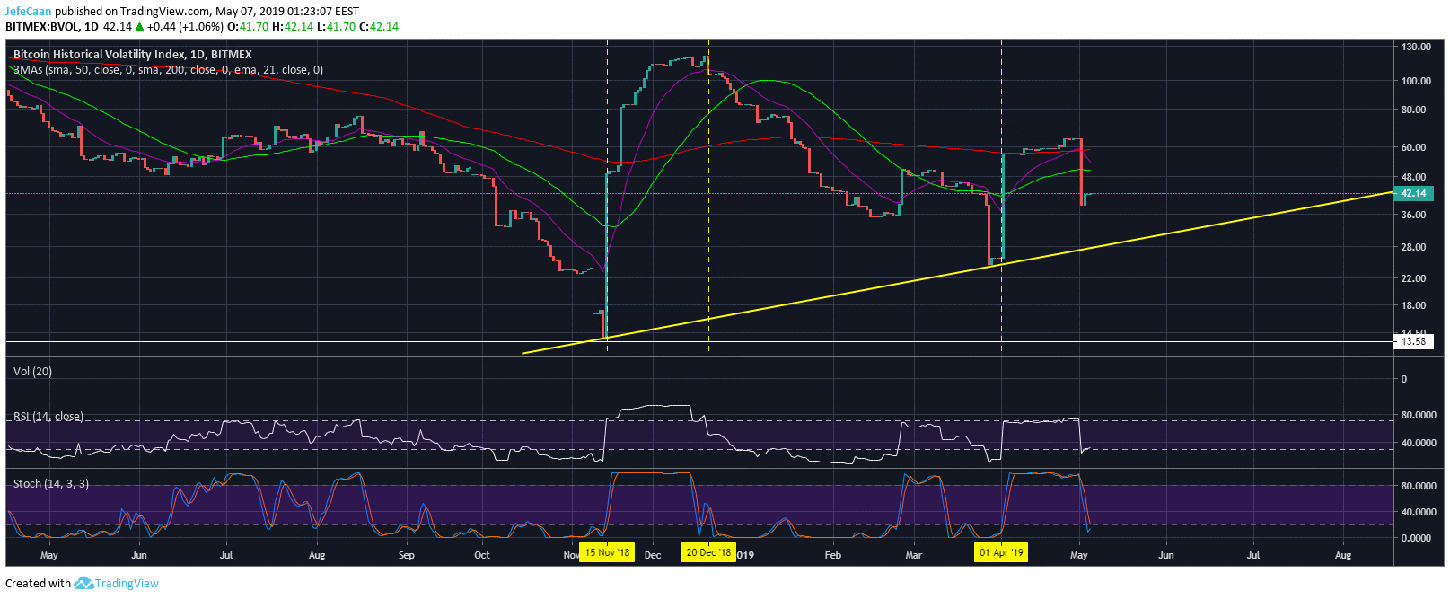
The daily chart for Bitcoin Volatility Index (BVOL) shows that the volatility has declined the past few days and could still decline some more in the next few weeks. However, Bitcoin (BTC) cannot keep on trading near current levels. Eventually it will have to break up or break down. The volatility index is a good indicator of when that big move can be expected. The chart shows exactly when the big moves occurred and the volatility peaked around those times. Considering that the volatility index is likely to decline to its trend line support, we can expect nothing of consequence for the next week or two. In the meantime, the bears will take it as a sign of consolidation and close their short positions. We could see a small move to the upside to see the price trade in the $6,000s but it will face very strong resistance as it is a strong distribution zone.
The game plan here is to keep on throwing the bulls more signs that the bear market might finally be over and when they act on those signs, the market makers or the whales disappoint them. This will continue happen until everybody loses interest in Bitcoin (BTC). There are still a lot of people waiting for that retracement to $4,200 so they can buy up. Most of it is whimsical traders who now feel guilty that they did not buy when the price was in the $3,000s. As long as these emotional traders are still around, there is not going to be a trend reversal.
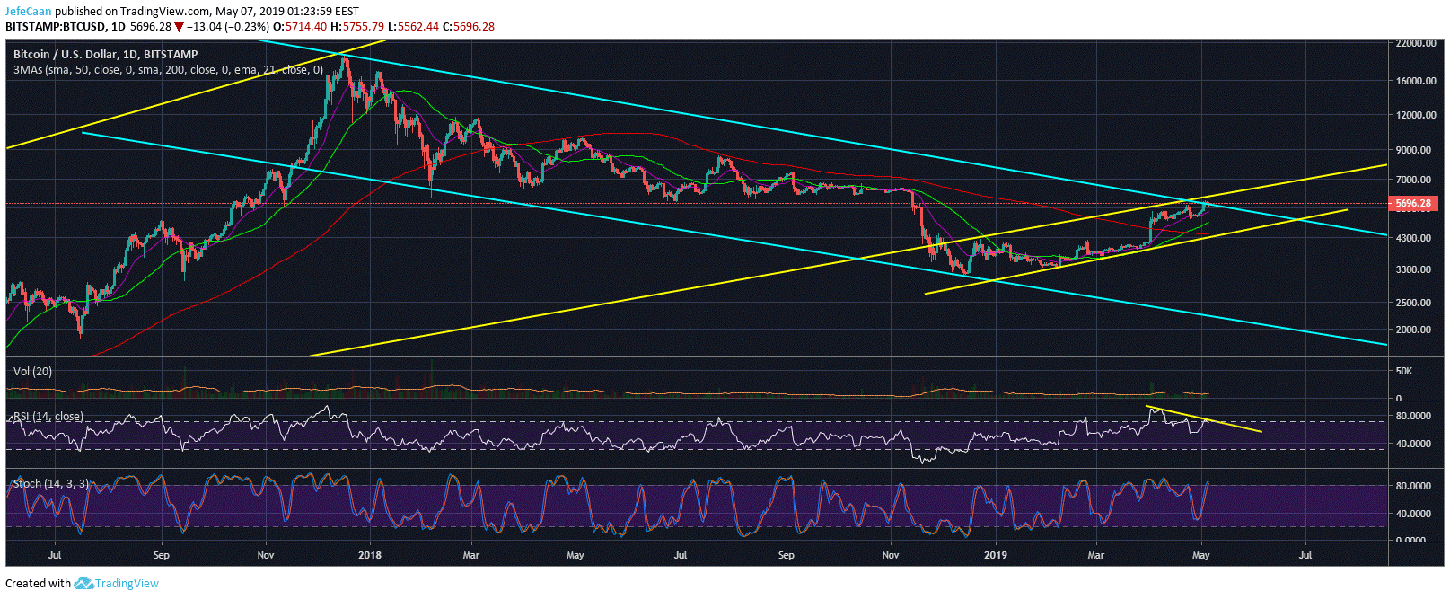
The daily chart for BTC/USD shows that the price has yet to retrace sharply to the bottom of an ascending channel even under the bullish case. Under the bearish case we could see it decline a lot lower. The bearish divergence on the RSI points to a strong probability of a decline in the days and weeks ahead. A lot of traders think the 200 week moving average is a strong support level that has never been breached (because it does not show on the charts) but that is not true. It has been breached before during the 2014-15 market cycle and there is no reason to assume that it will not be breached this time.
Investment Disclaimer