Published
4 years ago on
May 10, 2019
Bitcoin
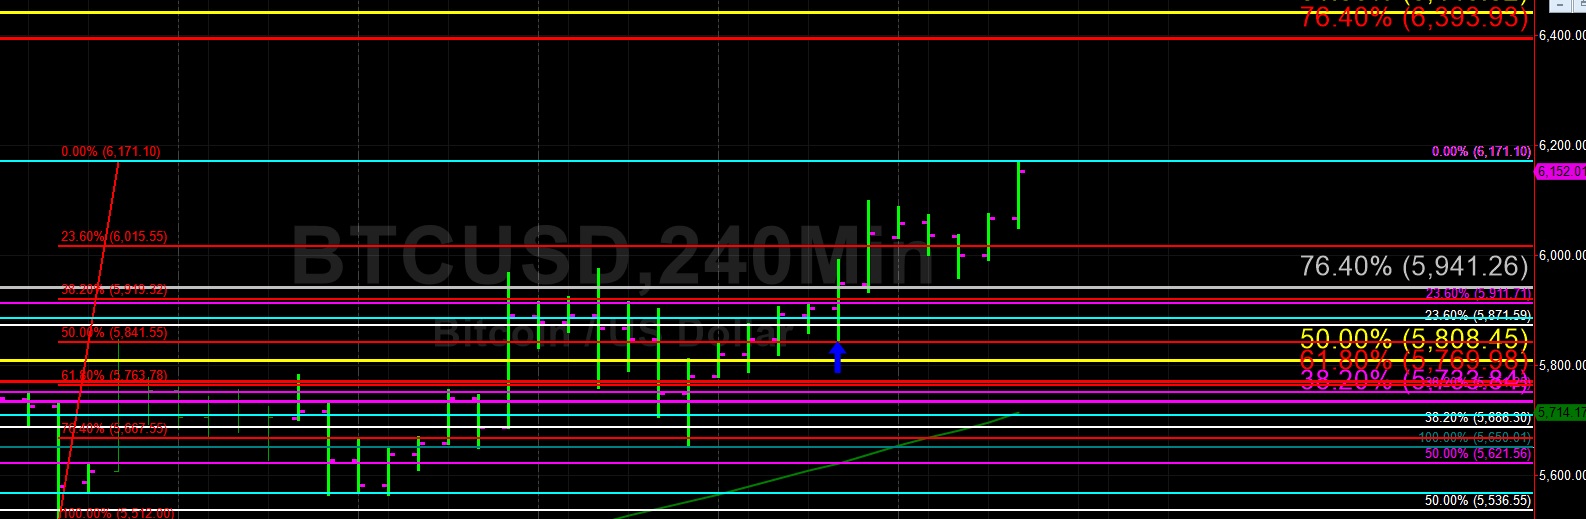
Bitcoin (BTC/USD) finally eclipsed the psychologically-important 6000.00 barrier in recent trading sessions and rocketed higher to the 6171.10 level early in today’s Asian session, its strongest level since mid-November 2018. After breaking above the 6000.00 figure, the pair traded as high as the 6098.21 area before consolidating some gains to the 5960.00 level and then again moving higher to establish fresh multi-month highs.
Chartists note that there does not appear to be too much technical Resistance between current price levels and the 6393 area. Technicians are waiting to see how the pair will react during pullbacks with the 6015/ 5919/ 5841 levels as new areas of technical Support along with 5941 and 5885. A deeper retracement would spotlight the 5567 and 5424 areas.
Price activity is nearest the 50-bar MA (4-hourly) at 5714.09 and the 50-bar MA (Hourly) at 5946.63.
Technical Support is expected around 5885.99/ 5709.61/ 5468.57 with Stops expected below.
Technical Resistance is expected around 6393.93/ 6440.82/ 6538.51 with Stops expected above.
On 4-Hourly chart, SlowK is Bullishly above SlowD while MACD is Bullishly above MACDAverage.
On 60-minute chart, SlowK is Bearishly below SlowD while MACD is Bullishly above MACDAverage.
Ethereum
Ethereum (ETH/USD) moved higher during today’s Asian session as traders pushed the pair to the 171.54 area after briefly trading below the 200-bar MA (4-hourly). Today’s intraday high is right around the 38.2% retracement of the move from 157.28 to 180.69. Additional buying pressure may open up the 175.17 area as the next upside target.
Chartists are eyeing some likely Stops above the 172.88 area, representing the 38.2% retracement of the move from 322.16 to 80.60. Below current price activity, the 165.38 area was supportive during yesterday’s North American session, representing the 61.8% retracement of the 155.91 – 180.69 area. Additionally, the 50-bar MA (4-hourly) was supportive around the 162.41 area during a pullback earlier this week.
Price activity is nearest the 200-bar MA (4-hourly) at 165.79 and the 100-bar MA (Hourly) at 168.88.
Technical Support is expected around the 162.36/ 159.25/ 148.81 levels with Stops expected below.
Technical Resistance is expected around the 177.80/ 183.33/ 187.62 levels with Stops expected above.
On 4-Hourly chart, SlowK is Bearishly below SlowD while MACD is Bearishly below MACDAverage.
On 60-minute chart, SlowK is Bullishly above SlowD while MACD is Bullishly above MACDAverage.
Investment Disclaimer