Published
4 years ago on
May 02, 2019
Bitcoin
Bitcoin (BTC/USD) extended recent gains by testing Offers around the 5330.00 figure following a pullback from yesterday’s daily high of 5358.39, its strongest showing since 25 April 2019. Before the move to yesterday’s daily high, Bids emerged right around the 50% retracement of the 4901.99 – 5650.01 range, and then following the yesterday’s daily high Bids emerged right around the 23.6% retracement of the move from 5072.01 to 5358.39. The Bids that have emerged at technical levels during the past two days suggest BTC/USD could be poised to appreciate further.
Notably, the 100-bar MA (4-hourly) just crossed above the 50-bar MA (4-hourly) and chartists wait to see how this may impact price activity. There are two important upcoming technical challenges for the pair. First, the 5364.27 level represents the 38.2% retracement of the 4901.9 – 5650.01 range. Second, the 5387.57 level represents the 61.8% retracement of the 5650.01 – 4963.00 range. A move above these areas technically opens up the 5473.48 area.
Price activity is nearest the 100-bar MA (4-hourly) at 5268.65 and the 200-bar MA (Hourly) at 5270.56.
Technical Support is expected around 5234.73/ 5125.13/ 4901.99 with Stops expected below.
Technical Resistance is expected around 5769.98/ 5941.26/ 6393.93 with Stops expected above.
On 4-Hourly chart, SlowK is Bullishly above SlowD while MACD is Bullishly above MACDAverage.
On 60-minute chart, SlowK is Bullishly above SlowD while MACD is Bearishly below MACDAverage.
Ethereum
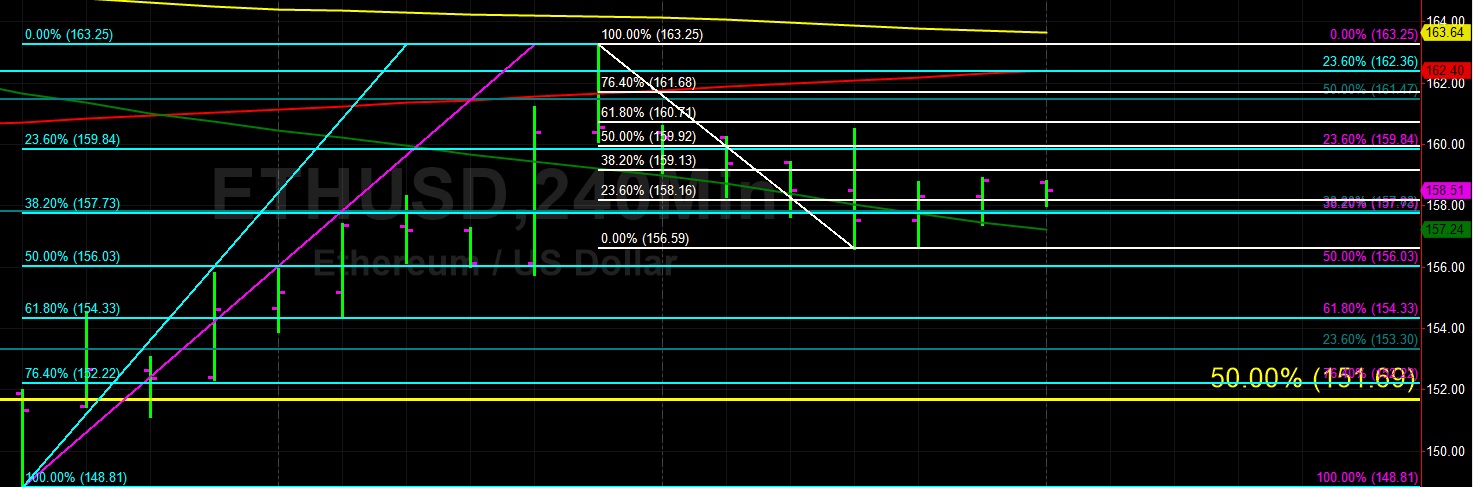
Ethereum (ETH/USD) found a little bit of buying pressure early in today’s Asian session as the pair climbed higher to the 158.77 level after finding some Bids around the 156.59 area. The pair continues to orbit the 50-bar MA (4-hourly), currently around 157.44. ETH/USD is really at a technical crossroads as the 157.82 level represents the 38.2% retracement of the 176.94 – 146.00 range, and the 157.73 area represents the 38.2% retracement of move from 152.22 to 163.25. Interestingly, the 50-bar MA (hourly) just crossed above the 200-bar MA (hourly) for the first time since 24 April 2019.
Additional selling pressure could see ETH/USD test technical Support around the 156.03/ 154.33/ 153.30 levels while additional buying pressure could see the pair test technical Resistance around the 159.92/ 161.47/ 162.36 areas. Chartists also note that the 200-bar MA (4-hourly) is now around 162.29 and could prove to represent headwinds.
Price activity is nearest the 50-bar MA (4-hourly) at 157.44 and the 50-bar MA (Hourly) at 157.90.
Technical Support is expected around the 156.03/ 151.69/ 146.74 levels with Stops expected below.
Technical Resistance is expected around the 161.47/ 165.25/ 172.88 levels with Stops expected above.
On 4-Hourly chart, SlowK is Bearishly below SlowD while MACD is Bullishly above MACDAverage.
On 60-minute chart, SlowK is Bullishly above SlowD while MACD is Bearishly below MACDAverage.
Litecoin
Litecoin (LTC/USD) continued to seek direction early in today’s Asian session after the pair tested Offers around yesterday’s high of 74.05, right around the 61.8% retracement of the move from 79.77 to 64.86. The pair is trying to establish a base above its 50-bar MA (4-hourly), currently around the 71.05 area. Another key level that traders are focusing on is 70.20, representing the 38.2% retracement of the 22.17 – 99.89 range.
Below current price activity, traders are focusing on technical Support around the 69.88/ 68.38/ 67.23 levels. Above current price activity, traders are focusing on technical Resistance around the 74.07/ 75.06/ 76.39 levels.
Price activity is nearest the 50-bar MA (4-hourly) at 71.05 and the 50-bar MA (Hourly) at 71.64.
Technical Support is expected around the 70.56/ 67.23/ 64.36 levels with Stops expected below.
Technical Resistance is expected around the 78.58/ 81.13/ 86.51 levels with Stops expected above.
On 4-Hourly chart, SlowK is Bullishly above SlowD while MACD is Bullishly above MACDAverage.
On 60-minute chart, SlowK is Bearishly below SlowD while MACD is Bearishly below MACDAverage.
Bitcoin Cash
BCH/USD (Bitcoin Cash/ US dollar) has been trading in a range over the past several hours as the pair continues to orbit the 275.42 level, representing the 23.6% retracement of the 929.99 – 73.22 range. Some Bids have emerged around the 265.54 level during today’s Asian session, around the 23.6% retracement of the 227.40 – 277.32 range.
The pair is now trading below the 200-bar MA (4-hourly) at 269.08 and the 50-bar MA (4-hourly) at 261.19, an indication it may be looking for direction. Chartists are eyeing some technical Support around the 259.72/ 249.23/ 240.89 levels and some technical Resistance around the 271.09/ 277.77/ 284.54 levels.
Price activity is nearest the 200-bar MA (4-hourly) at 269.08 and the 200-bar MA (Hourly) at 261.69.
Technical Support is expected around the 255.97/ 240.89/ 227.40 levels with Stops below.
Technical Resistance is expected around the 284.54/ 296.99/ 309.61 levels with Stops above.
On 4-Hourly chart, SlowK is Bullishly above SlowD while MACD is Bullishly above MACDAverage.
On 60-minute chart, SlowK is Bearishly below SlowD while MACD is Bearishly below MACDAverage.
Investment Disclaimer