Published
4 years ago on
May 06, 2019
Bitcoin
Bitcoin (BTC/USD) reversed course and found some buying pressure during today’s Asian session with the pair climbing higher to the 5782.22 level after drifting sideways during yesterday’s European and North American sessions. Today’s intraday high was right around the 76.4% retracement of the move from 5831.39 to 5627.35 and a break above this area will open up the 5808.45 level, representing the 50% retracement of the 8488.00 – 3128.89 range.
Yesterday’s pullback in BTC/USD saw the market move lower around the area that represents the 38.2% retracement of the move from 5265.61 to 5846.88. If the market is able to move through recent upside congestion, technical Resistance around 5941.26 may be encountered, representing the 76.4% retracement of the 6810.00 – 3128.89 range.
Price activity is nearest the 50-bar MA (4-hourly) at 5399.11 and the 50-bar MA (Hourly) at 5709.54.
Technical Support is expected around 5468.57/ 5234.73/ 5125.13 with Stops expected below.
Technical Resistance is expected around 5941.26/ 6393.93/ 6440.82 with Stops expected above.
On 4-Hourly chart, SlowK is Bearishly below SlowD while MACD is Bearishly below MACDAverage.
On 60-minute chart, SlowK is Bearishly below SlowD while MACD is Bearishly below MACDAverage.
Ethereum
Ethereum (ETH/USD) was unable to sustain gains early in today’s Asian session with the pair declined from the 163.40 level, right around the 50% retracement of the recent move from 169.26 to 157.28. Minor Stops were elected below the 157.63 area late in yesterday’s North American session, representing the 50% retracement of the move from 146.00 to 169.26. The pair continues to orbit the 100-bar MA (4-hourly) and has moved above and below several times over recent days.
On the upside, ETH/USD will need to contend with targets such as 164.68/ 166.43 in a move to establish new recent highs. Traders are also interested to see how the pair will react around the 168.47 level, the 61.8% retracement of the move from 222.78 to 80.60. Above that area, the 172.88 area remains technically relevant, representing the 38.2% retracement of the 322.16 – 80.60 range.
Price activity is nearest the 100-bar MA (4-hourly) at 162.27 and the 100-bar MA (Hourly) at 161.33.
Technical Support is expected around the 154.89/ 151.49/ 146.00 levels with Stops expected below.
Technical Resistance is expected around the 169.26/ 172.88/ 183.33 levels with Stops expected above.
On 4-Hourly chart, SlowK is Bullishly above SlowD while MACD is Bearishly below MACDAverage.
On 60-minute chart, SlowK is Bearishly below SlowD while MACD is Bullishly above MACDAverage.
Litecoin
Litecoin (LTC/USD) tested a key technical level early in today’s Asian session and then came off, unable to move above the 76.66 level which is right around the 61.8% retracement of the move from 83.90 to 64.86. The area also coincides with the 38.2% retracement of the 81.50 to 73.50. The pair continues to trade above its 100-bar MA (4-hourly) and bounced above the 74.38 level during yesterday’s North American session, the 50% retracement of the 83.90 – 64.86 range.
If the pair is going to test technical Resistance on the upside, it will need to get through levels such as 77.50 and 78.44 before encountering more important targets such as 81.55 and 82.38. On the downside, areas such as 73.18 and 71.22 represent short-term technical Support. Chartists also note the 50-bar MA (4-hourly) is around 72.57 and bullishly converging with the 100-bar MA (4-hourly), now around 74.15.
Price activity is nearest the 100-bar MA (4-hourly) at 74.15 and the 100-bar MA (Hourly) at 75.14.
Technical Support is expected around the 70.56/ 67.23/ 64.36 levels with Stops expected below.
Technical Resistance is expected around the 81.55/ 83.97/ 86.51 levels with Stops expected above.
On 4-Hourly chart, SlowK is Bearishly below SlowD while MACD is Bearishly below MACDAverage.
On 60-minute chart, SlowK is Bearishly below SlowD while MACD is Bearishly below MACDAverage.
Bitcoin Cash
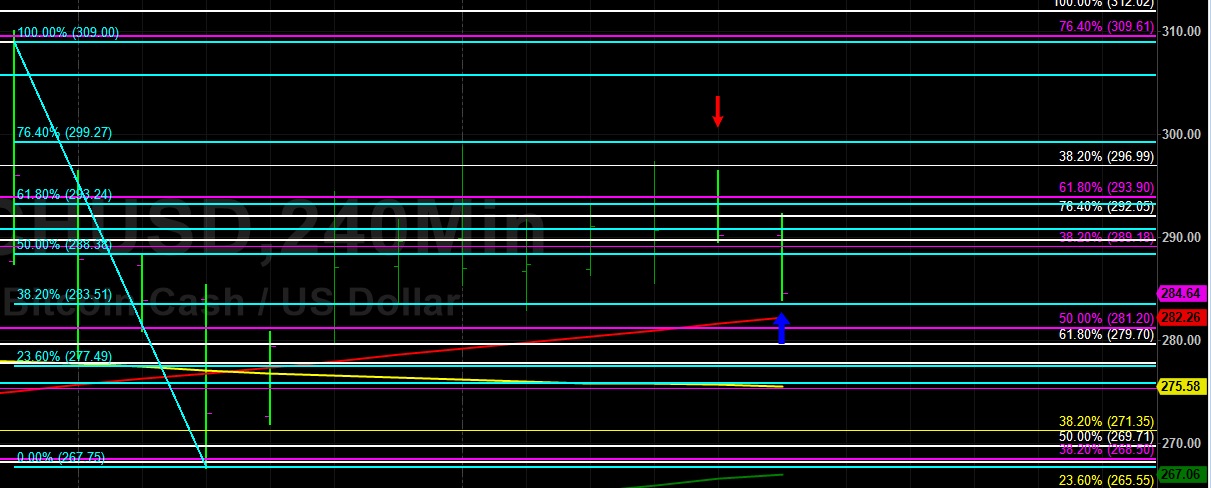
BCH/USD (Bitcoin Cash/ US dollar) was unable to sustain early gains during today’s Asian session, declining to the 284.66 area after trading as high as the 297.39 level during yesterday’s North American session. Notably, yesterday’s high was right around the 38.2% retracement of the 659.00 – 73.22 range and the market has so far managed to remain above the 283.51 level today, representing the 38.2% retracement of the move from 310.00 to 267.75.
In recent sessions, the 298.88 level has been toppish, just below the 76.4% retracement of the aforementioned range. A move above this area will open up a possible test of the 305.74 level, representing the 61.8% retracement of the move from 349.99 to 227.40.
Price activity is nearest the 200-bar MA (4-hourly) at 278.62 and the 50-bar MA (Hourly) at 282.71.
Technical Support is expected around the 265.55/ 240.89/ 227.40 levels with Stops below.
Technical Resistance is expected around the 309.00/ 314.12/ 335.00 levels with Stops above.
On 4-Hourly chart, SlowK is Bullishly above SlowD while MACD is Bearishly below MACDAverage.
On 60-minute chart, SlowK is Bearishly below SlowD while MACD is Bullishly above MACDAverage.