Published
4 years ago on
May 07, 2019
Bitcoin
Bitcoin (BTC/USD) found some buying pressure early in today’s Asian session as the pair moved back to the 5750.00 level after declining to the 5651.00 area during yesterday’s North American session. Earlier in the North American session, the pair got as high as the 5753.66 level before spinning lower, a level that is right around the 23.6% retracement of the 5520.00 – 5831.39 range.
Notably, BTC/USD was supported above the 5650.01 area during the brief pullback, previously a relative high dating to 23 April 2019. A move back above recent highs will spotlight the 5808.45 area, representing the 50% retracement of the 8488.00 – 3128.89 range and an area that we have spotlighted extensively. The pair must decisively move above this zone and clear Stops if it is going to challenge the 5941.26 level, representing the 76.4% retracement of the move from 6810.00 to 3128.89.
Price activity is nearest the 50-bar MA (4-hourly) at 5467.36 and the 50-bar MA (Hourly) at 5692.37.
Technical Support is expected around 5468.57/ 5234.73/ 5125.13 with Stops expected below.
Technical Resistance is expected around 5941.26/ 6393.93/ 6440.82 with Stops expected above.
On 4-Hourly chart, SlowK is Bullishly above SlowD while MACD is Bearishly below MACDAverage.
On 60-minute chart, SlowK is Bullishly above SlowD while MACD is Bullishly above MACDAverage.
Ethereum
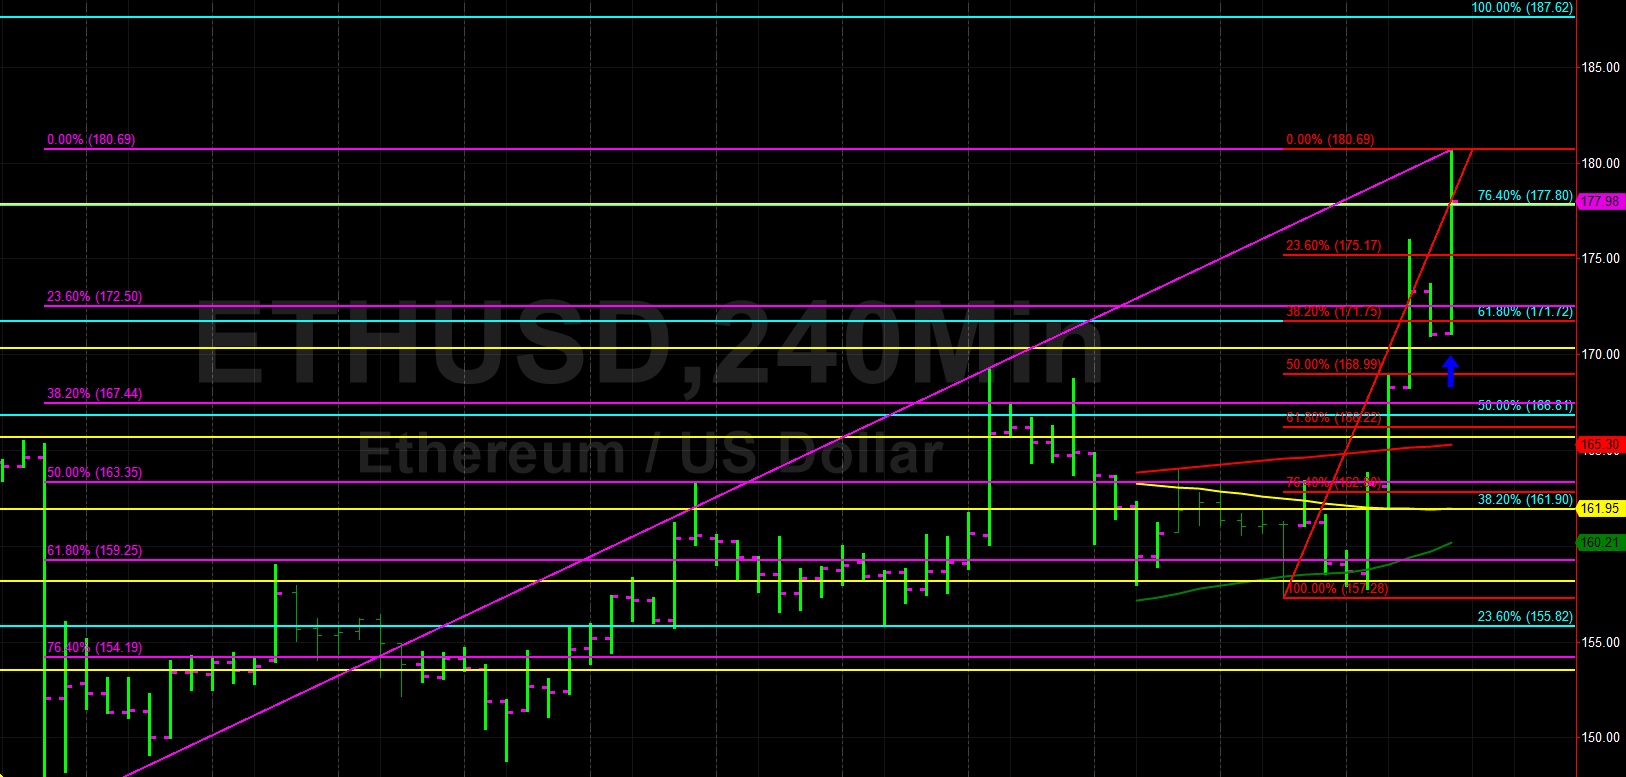
Ethereum (ETH/USD) exploded higher to the 180.69 level during today’s Asian session, reaching its highest print since 10 April 2019. A series of Stops were elected during yesterday’s dealing, first above the 170.38 level, right around the 76.4% retracement of the 177.84 – 146.00 range. More powerful Stops were then triggered above the 171.72 and 177.80 areas, representing the 61.8% and 76.4% retracements of the 187.62 – 146.00 range.
A bullish clue emerged late in yesterday’s North American session during a brief pullback when Bids emerged above the 170.33 level, signaling that traders remained positive, and the price catapulted higher. Chartists are looking to see if new areas of possible technical Support around the 175.17/ 171.75/ 168.99 areas remain supportive during pullbacks. Below those levels, the 166.81 and 161.90 levels will be closely watched.
Price activity is nearest the 200-bar MA (4-hourly) at 165.30 and the 50-bar MA (Hourly) at 164.20.
Technical Support is expected around the 170.33/ 167.44/ 163.35 levels with Stops expected below.
Technical Resistance is expected around the 183.33/ 187.62/ 191.40 levels with Stops expected above.
On 4-Hourly chart, SlowK is Bearishly below SlowD while MACD is Bullishly above MACDAverage.
On 60-minute chart, SlowK is Bullishly above SlowD while MACD is Bullishly above MACDAverage.
Litecoin
Litecoin (LTC/USD) launched higher during today’s Asian session, reaching the 77.90 area after Bids emerged around the 74.05 level late in yesterday’s North American session. This buying activity was right around the 61.8% retracement of the 79.77 – 64.86 range. Stops were then elected above the 77.32 area, representing the 61.8% retracement of the 81.50 – 70.55 range.
Any additional upside pressure will need to clear a few technical hurdles. First, the 78.24 level represents the 38.2% retracement of the 99.89 – 64.86 range. Second, the 200-bar MA (4-hourly) is now indicating around 78.55. Third, the 78.92 area is the 76.4% retracement of the recent depreciation from 81.50 to 70.55. Fourth, the 79.41 area is the 76.4% retracement of the move from 83.90 to 64.86.
Price activity is nearest the 200-bar MA (4-hourly) at 78.55 and the 100-bar MA (Hourly) at 75.53.
Technical Support is expected around the 70.56/ 67.23/ 64.36 levels with Stops expected below.
Technical Resistance is expected around the 81.55/ 83.97/ 86.51 levels with Stops expected above.
On 4-Hourly chart, SlowK is Bullishly above SlowD while MACD is Bearishly below MACDAverage.
On 60-minute chart, SlowK is Bullishly above SlowD while MACD is Bullishly above MACDAverage.
Bitcoin Cash
BCH/USD (Bitcoin Cash/ US dollar) bounced off a key technical level early in today’s Asian session, finding Bids around the 285.63 area, just above the 200-bar MA (4-hourly). Late in the North American session, Bids also emerged right around the same indicator, then around the 284.69 area. Stops were elected above the 293.24 area during the move higher, representing the 61.8% retracement of the move from 309.00 – 267.75.
The next upside target for the pair is the 299.27 level, right around the 76.4% retracement of the aforementioned range. Above that level, the 305.74 area represents the 61.8% retracement of the move from 354.17 to 227.40. Also, the 309.61 area represents the 76.4% retracement of the move from 335.00 – 227.40.
Price activity is nearest the 200-bar MA (4-hourly) at 285.21 and the 50-bar MA (Hourly) at 287.69.
Technical Support is expected around the 277.83/ 265.55/ 258.57 levels with Stops below.
Technical Resistance is expected around the 309.00/ 314.12/ 335.00 levels with Stops above.
On 4-Hourly chart, SlowK is Bullishly above SlowD while MACD is Bearishly below MACDAverage.
On 60-minute chart, SlowK is Bullishly above SlowD while MACD is Bullishly above MACDAverage.