Published
4 years ago on
May 08, 2019
Bitcoin
Bitcoin (BTC/USD) was volatile early in today’s Asian session as the pair came off to the 5656.26 area, just above the 5650.01 level that it has bounced above several times in recent trading sessions. During yesterday’s European session, the pair raced higher to the 5974.51 level, its strongest showing since 14 November 2018. Price faded during yesterday’s European and North American sessions after stopping short of testing the psychologically-important 6000 area.
Traders are paying very close attention to how BTC/USD reacts on pullbacks. Chartists are eyeing some new retracement levels including 5581.93/ 5463.76/ 5345.58, related to the 4963.00 – 5974.51 range. Other key levels to watch include the 5629.76 area, representing the 38.2% retracement of the move from 5072.01 to 5974.51, followed by the 5564.81 level.
Price activity is nearest the 50-bar MA (4-hourly) at 5551.72 and the 50-bar MA (Hourly) at 5763.13.
Technical Support is expected around 5468.57/ 5234.73/ 5125.13 with Stops expected below.
Technical Resistance is expected around 6393.93/ 6440.82/ 6538.51 with Stops expected above.
On 4-Hourly chart, SlowK is Bearishly below SlowD while MACD is Bearishly below MACDAverage.
On 60-minute chart, SlowK is Bearishly below SlowD while MACD is Bearishly below MACDAverage.
Ethereum
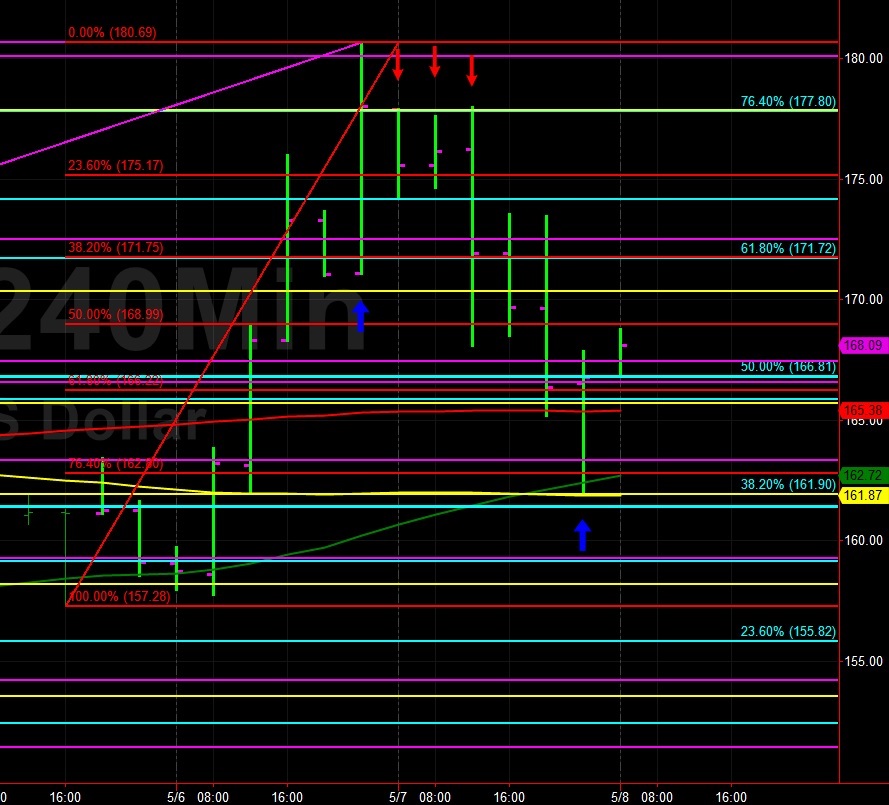
Ethereum (ETH/USD) extended its slide lower during today’s Asian session as the pair weakened to the 162.00 figure before some buying activity emerged. Two days ago, the paid traded as high as the 180.69 area, its strongest level since 10 April 2019. Stops were elected below the 162.80 level during the move lower today, representing the 76.4% retracement of the move from 157.28 to 180.69.
A very important level over the past several trading sessions has been the 177.80 area. The area was toppish on retracements higher and represents the 76.4% retracement of the move from 187.62 to 146.00. Today’s move lower also saw traders test again the 50-bar MA (4-hourly) around the 162.40 area, an indicator that has been supportive since 30 April 2019.
Price activity is nearest the 50-bar MA (4-hourly) at 162.40 and the 100-bar MA (Hourly) at 165.93.
Technical Support is expected around the 159.25/ 148.81/ 137.61 levels with Stops expected below.
Technical Resistance is expected around the 177.80/ 183.33/ 187.62 levels with Stops expected above.
On 4-Hourly chart, SlowK is Bearishly below SlowD while MACD is Bearishly below MACDAverage.
On 60-minute chart, SlowK is Bullishly above SlowD while MACD is Bearishly below MACDAverage.
Litecoin
Litecoin (LTC/USD) depreciated early in today’s Asian session, falling as low as the 71.31 level after moving back below the 50-bar MA (4-hourly) and 100-bar MA (4-hourly). Bids emerged around the 71.31 area after the decline, representing the 61.8% retracement of the move from 64.86 to 81.50. The pair attempted to move back above the 50-bar MA (4-hourly) during a push higher but was capped around the 73.89 level.
Continued selling pressure may see LTC/USD test some important technical levels including the 70.20 area, representing the 38.2% retracement of the same range, followed by the 61.03 area, the 50% retracement of the same range. Another extremely important level that chartists are watching is the 62.46 area, representing the 23.6% retracement of the move from 192.89 to 22.17. Given the significant flurry of Stops elected around the 87.39 area in early April, the importance of 62.46 as a key downside target cannot be overstated.
Price activity is nearest the 100-bar MA (4-hourly) at 73.24 and the 200-bar MA (Hourly) at 73.92.
Technical Support is expected around the 70.56/ 67.23/ 64.36 levels with Stops expected below.
Technical Resistance is expected around the 81.55/ 83.97/ 86.51 levels with Stops expected above.
On 4-Hourly chart, SlowK is Bearishly below SlowD while MACD is Bearishly below MACDAverage.
On 60-minute chart, SlowK is Bullishly above SlowD while MACD is Bearishly below MACDAverage.
Bitcoin Cash
BCH/USD (Bitcoin Cash/ US dollar) encountered some selling pressure early in today’s Asian session, driven lower to the 270.00 figure after peaking around the 296.34 level during yesterday’s European session. Stops were elected below the 200-bar MA (4-hourly) during yesterday’s European and North American session and traders were also able to trigger Stops below the 50-bar MA (4-hourly) and 100-bar MA (4-hourly) during today’s move lower.
Bids emerged right around the 270.00 figure during the pullback, just above the 50% retracement of the 312.02 – 227.40 range. If more selling pressure develops, technicians will focus on the 259.72 area, the 38.2% retracement of the same range. Chartists are noting that the 50-bar MA (4-hourly) is bullishly converging with the 200-bar MA (4-hourly), and that the 50-bar MA (4-hourly) just bullishly crossed above the 100-bar MA (4-hourly).
Price activity is nearest the 200-bar MA (4-hourly) at 285.38 and the 50-bar MA (Hourly) at 286.32.
Technical Support is expected around the 265.55/ 258.57/ 252.79 levels with Stops below.
Technical Resistance is expected around the 296.99/ 309.00/ 314.12 levels with Stops above.
On 4-Hourly chart, SlowK is Bearishly below SlowD while MACD is Bearishly below MACDAverage.
On 60-minute chart, SlowK is Bullishly above SlowD while MACD is Bearishly below MACDAverage.