Published
4 years ago on
May 19, 2019
Bitcoin
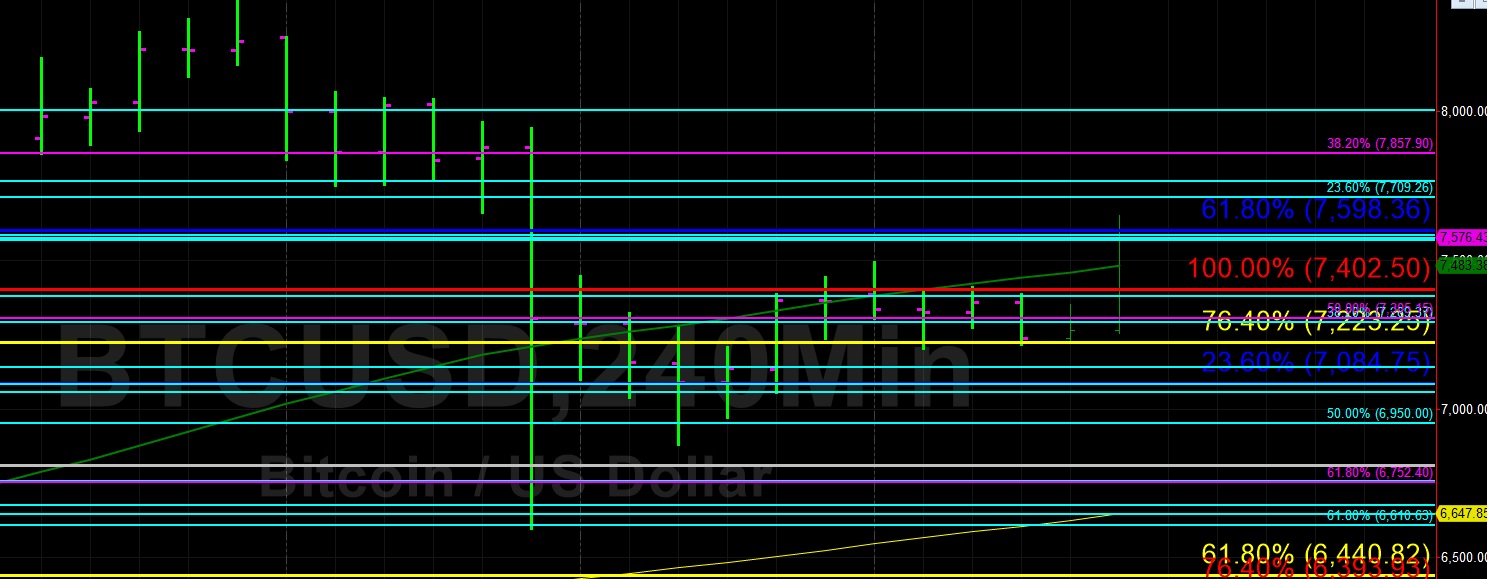
Bitcoin (BTC/USD) found some buying pressure early in today’s Asian session and lifted higher to the 7578.75 area, not too far below the 50-bar MA (4-hourly). During yesterday’s European session, the 50-bar MA (4-hourly) was toppish for several hours and then traders were unable to move the price above the same barrier during the North American session. The pair is still trying to claw back the losses it incurred following its sharp move lower two days ago.
Above current price activity, the 7709.26 area is a key level that traders continue to focus on, representing the 23.6% retracement of the move from 5512.00 to 8388.00. Below current price activity, the 6950.00 level is being closely watched by chartists, representing the 50% retracement of the same range. Technicians are also eyeing the 100-bar MA (4-hourly), now coming in around 6647.29.
Price activity is nearest the 50-bar MA (4-hourly) at 7482.31 and the 200-bar MA (Hourly) at 7363.97.
Technical Support is expected around 7204.87/ 6830.99/ 6440.82 with Stops expected below.
Technical Resistance is expected around 7966.03/ 8195.00/ 8488.00 with Stops expected above.
On 4-Hourly chart, SlowK is Bullishly above SlowD while MACD is Bearishly below MACDAverage.
On 60-minute chart, SlowK is Bullishly above SlowD while MACD is Bullishly above MACDAverage.

Ethereum
Ethereum (ETH/USD) gained ground early in today’s Asian session and was lifted to the 244.59 area after encountering some selling pressure during yesterday’s European and North American sessions. Stops were elected above the 242.28 area during today’s move higher, representing the 100-bar MA (hourly), after Stops were triggered above the 238.15 area, representing the 50-bar MA (hourly). Notably, the 100-bar MA (hourly) has just crossed above the 50-bar MA (hourly) and traders are waiting to see if this results in selling pressure.
Chartists are working to determine important levels given the pair’s recent movements. Technical Support may be derived around the 229.91 area, representing the 38.2% retracement of the 146.00 – 279.21 range. Below this level, the 213.89 area is the 50% retracement of the same range. On the upside, the 249.73 area is the 23.6% retracement of the same range and was toppish during Saturday’s price activity. Traders are also eyeing the 259.27 and 267.87 areas as areas of upside technical Resistance.
Price activity is nearest the 50-bar MA (4-hourly) at 219.14 and the 100-bar MA (Hourly) at 242.27.
Technical Support is expected around 219.53/ 204.84/ 185.46 with Stops expected below.
Technical Resistance is expected around 258.92/ 272.56/ 281.77 with Stops expected above.
On 4-Hourly chart, SlowK is Bullishly above SlowD while MACD is Bearishly below MACDAverage.
On 60-minute chart, SlowK is Bullishly above SlowD while MACD is Bullishly above MACDAverage.
Investment Disclaimer