Published
4 years ago on
May 20, 2019
Bitcoin
Bitcoin (BTC/USD) encountered some profit-taking early in the Asian session after being lifted to the 8315.00 area late in yesterday’s North American session, just below the 76.4% retracement of the move from 9948.12 to 3128.89. The pair then traded as low as the 7800.00 figure early in the Asian session. Both 8186 and 8210 represented short-term upside price objectives following yesterday’s price activity and Stops were elected above both of those areas, pushing the pair close to fresh multi-month highs and to levels that preceded the massive sell-off late last week.
Chartists are again focusing on important levels of technical Resistance and upside price objectives. The 8488.00 figure represents a relative high dating to July 2018 and the 9948.12 area represents a relative high dating to May 2018. Upside price objectives related to short-term price activity this weekend include 8406.26/ 8505.94/ 8678.17. Below current price activity, traders are eyeing the 50-bar MA (4-hourly), currently around 7647.97 followed by 7709.26 and 7580.79.
On a 60-minute chart, the 50-bar, 100-bar, and 200-bar MAs have converged and are trading within US$ 25.00 of each other.
Price activity is nearest the 50-bar MA (4-hourly) at 7647.97 and the 100-bar MA (Hourly) at 7647.12.
Technical Support is expected around 7548.79/7204.87/ 6830.99 with Stops expected below.
Technical Resistance is expected around 8488.00/ 8678.17/ 9117.00 with Stops expected above.
On 4-Hourly chart, SlowK is Bearishly below SlowD while MACD is Bullishly above MACDAverage.
On 60-minute chart, SlowK is Bearishly below SlowD while MACD is Bearishly below MACDAverage.

Ethereum
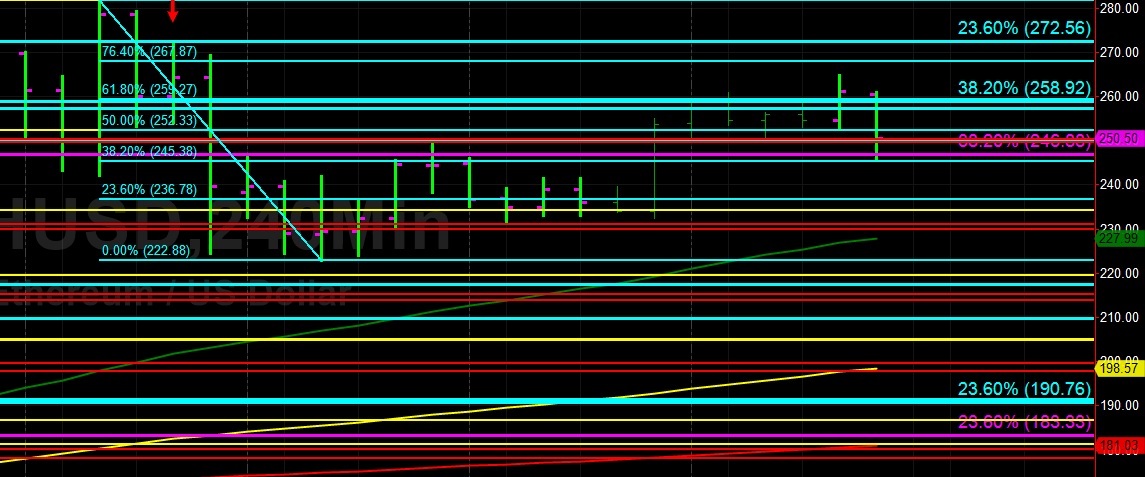
Ethereum (ETH/USD) depreciated early in today’s Asian session, receding to the 245.88 level after peaking around the 264.77 area during yesterday’s North American session. Today’s intraday low is right around the 38.2% retracement of the move from 281.77 to 222.88. Additional selling pressure could see the 236.78 area challenged, representing the 23.6% retracement of the same range. Just below that area, the 234.21 area is important with the 230.98, 219.53, and 215.29 levels of technical significance below there. Chartists are also eyeing the 50-bar MA (4-hourly) around the 227.98 area at present.
Yesterday’s renewed buying pressure has technicians speculating where ETH/USD could be headed next on the upside. 267.87 represents the 76.4% retracement of the aforementioned 281.77 – 222.88 range. Additional upside price objectives related to yesterday’s price activity include 267.60, 278.57, and 289.46. Notably, price activity is now around both the 50-bar MA (hourly) and 100-bar MA (hourly).
Price activity is nearest the 50-bar MA (4-hourly) at 227.99 and the 100-bar MA (Hourly) at 248.00.
Technical Support is expected around 219.53/ 204.84/ 185.46 with Stops expected below.
Technical Resistance is expected around 272.56/ 281.77/ 289.46 with Stops expected above.
On 4-Hourly chart, SlowK is Bearishly below SlowD while MACD is Bullishly above MACDAverage.
On 60-minute chart, SlowK is Bearishly below SlowD while MACD is Bearishly below MACDAverage.
Investment Disclaimer