Published
4 years ago on
May 22, 2019
Bitcoin
Bitcoin (BTC/USD) found a little bit of buying interest early during today’s Asian session after trading as low as 7805.34 during yesterday’s European session and trading as high as the 8112.99 level during yesterday’s North American session. The pair remained above the 50-bar MA (4-hourly) during yesterday’s European session and continues to orbit the 50-bar MA (hourly), currently around 7930.15. The pair also continues to trade right around the 7966.03 level, representing the 76.4% retracement of the range from 8388.00 to 6600.00.
Chartists continue to evaluate the pair’s upside potential and identify the 8139.25 area as an upside target, representing the 76.4% retracement of the 8315.00 – 7570.31 range. Traders are also looking to see if the pair can gain a foothold around the 7966.03 area, representing the 76.4% retracement of the move from 8388.00 to 6600.00. Above current price activity, the 9948.12 area is a relative high dating to May 2018.
Price activity is nearest the 50-bar MA (4-hourly) at 7811.15 and the 50-bar MA (Hourly) at 7930.15.
Technical Support is expected around 7548.79/7204.87/ 6830.99 with Stops expected below.
Technical Resistance is expected around 8488.00/ 8678.17/ 9117.00 with Stops expected above.
On 4-Hourly chart, SlowK is Bullishly above SlowD while MACD is Bearishly below MACDAverage.
On 60-minute chart, SlowK is Bullishly above SlowD while MACD is Bullishly above MACDAverage.

Ethereum
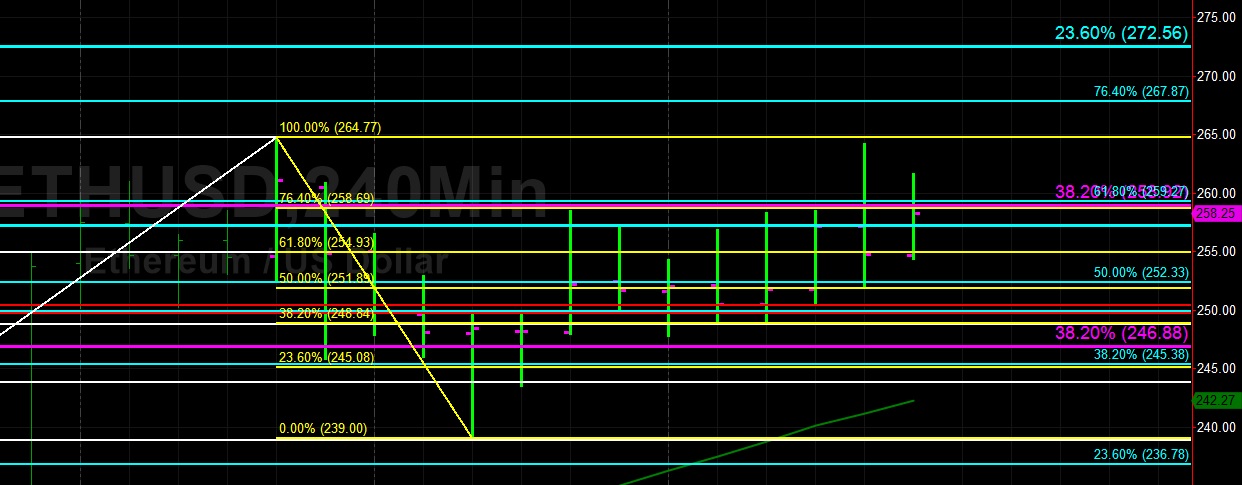
Ethereum (ETH/USD) gained ground early in today’s Asian session as traders lifted the pair to the 261.62 area after finding some buying pressure just below the 254.93 area, representing the 61.8% retracement of the move from 264.77 to 239.00. Stops were elected above the 258.92 area late in yesterday’s North American session, a key level we have identified numerous times that represents the 38.2% retracement of the move from 547.40 to 80.60.
Above current price activity, traders are eyeing the 264.77 area, a recent relative high above which Stops are likely in place. Thereafter, the 267.87 level represents the 76.4% retracement of the move from 281.77 to 222.88, and the 272.56 area represents the 23.6% retracement of the 894.00 – 80.60 range. Stops are also likely in place above the 281.77 area, the recent multi-month high of ETH/USD. If the market is able to go on to establish new multi-month highs, technicians are already eyeing the 298.24 area, representing the 50% retracement of the 515.88 – 80.60 range.
Price activity is nearest the 50-bar MA (4-hourly) at 242.25 and the 50-bar MA (Hourly) at 251.89.
Technical Support is expected around 238.88/ 219.53/ 204.84 with Stops expected below.
Technical Resistance is expected around 272.56/ 281.77/ 289.46 with Stops expected above.
On 4-Hourly chart, SlowK is Bullishly above SlowD while MACD is Bearishly below MACDAverage.
On 60-minute chart, SlowK is Bullishly above SlowD while MACD is Bullishly above MACDAverage.
Investment Disclaimer