Published
4 years ago on
June 17, 2019
Bitcoin
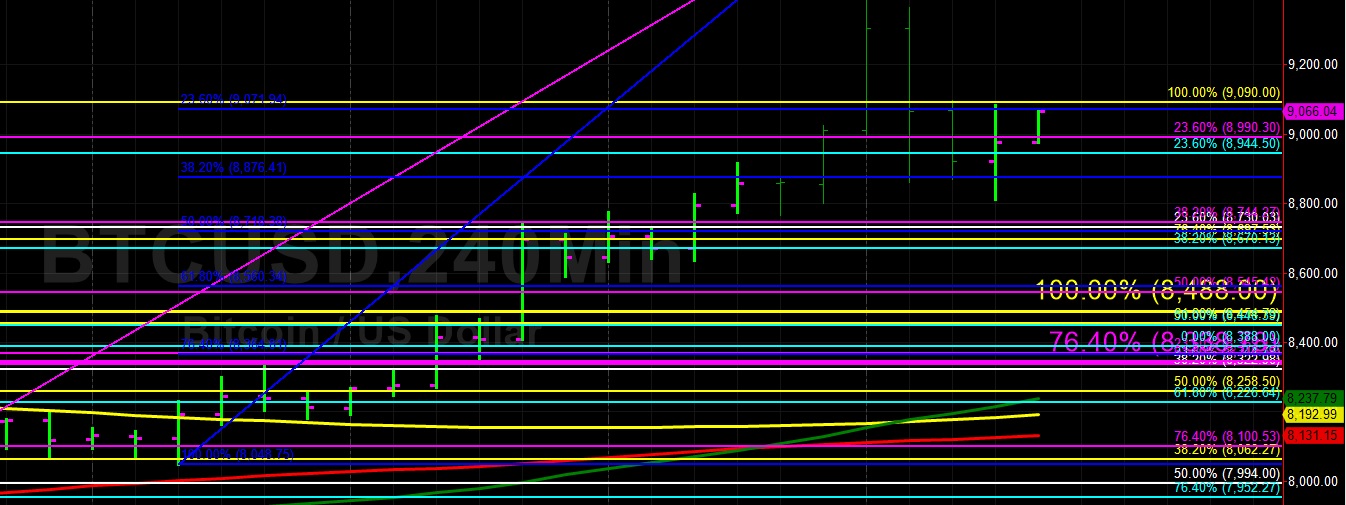
Bitcoin (BTC/USD) recovered some lost ground early in today’s Asian session as the pair traded as high as the 9083.76 area after finding some demand around the 8810.53 area. The pair established a fresh 2019 high during yesterday’s European session, establishing its strongest print since May 2018. Stops were elected above the 9090.00 area, a relative high dating to 30 May 2019. During the pullback lower during yesterday’s European session, Bids emerged around the 8876.41 area, representing the 38.2% retracement of the move from 8048.75 to 9388.00.
Technical Resistance then emerged around the 9071.94 area during yesterday’s North American session, representing the 23.6% retracement of the aforementioned range. Traders are again focusing on the 9532.39 area, representing the 38.2% retracement of the very important move from 19891.99 to 3128.89. Above that area, the 9948.12 area is a relative high. Below current market activity, the 8630.17 area may provide some technical Support, representing the 23.6% retracement of the move from 7702.83 to 8916.63.
Price activity is nearest the 50-bar MA (4-hourly) at 8236.52 and the 50-bar MA (Hourly) at 8827.03.
Technical Support is expected around 8718.38 8585.10/ 8278.55 with Stops expected below.
Technical Resistance is expected around 9532.19/ 9948.12/ 11510.44 with Stops expected above.
On 4-Hourly chart, SlowK is Bearishly below SlowD while MACD is Bullishly above MACDAverage.
On 60-minute chart, SlowK is Bearishly below SlowD while MACD is Bearishly below MACDAverage.
Ethereum
Ethereum (ETH/USD) appreciated early in today’s Asian session as the pair traded as high as the 271.63 area after finding Bids around the 263.68 area, representing the 38.2% retracement of the move from 222.88 to 288.77. During yesterday’s European session, the pair climbed to the 278.83 area, its strongest showing since 30 May. Stops were elected above the 274.99 area during the pair’s ascent yesterday. The pair collapsed later in yesterday’s European session and then early in yesterday’s North American session. Interestingly, the 50-bar MA, 100-bar MA, and 200-bar MA on 4-hourly charts are all within US$ 0.30.
Stops were triggered below the 266.49 area during the move lower, representing the 23.6% retracement of the move from 226.56 to 278.83. Above current market activity, the 288.77 is a recent relative high and the 302.20 area is another relative high. The 289.64 area is the 38.2% retracement of the move from 627.83 to 80.60 and the 293.56 area is the 23.6% retracement of the move from 982.99 to 80.60. Also, the 298.24 level is the 50% retracement of the move from 515.88 to 80.60 and the 314.00 area is the 50% retracement of the 547.40 – 80.60 range.
Price activity is nearest the 100-bar MA (4-hourly) at 253.62 and the 50-bar MA (Hourly) at 266.99.
Technical Support is expected around 255.45/ 246.23/ 241.17 with Stops expected below.
Technical Resistance is expected around 288.77/ 293.56/ 302.20 with Stops expected above.
On 4-Hourly chart, SlowK is Bearishly below SlowD while MACD is Bearishly below MACDAverage.
On 60-minute chart, SlowK is Bullishly above SlowD while MACD is Bearishly below MACDAverage.
Investment Disclaimer