Published
4 years ago on
June 09, 2019
Bitcoin
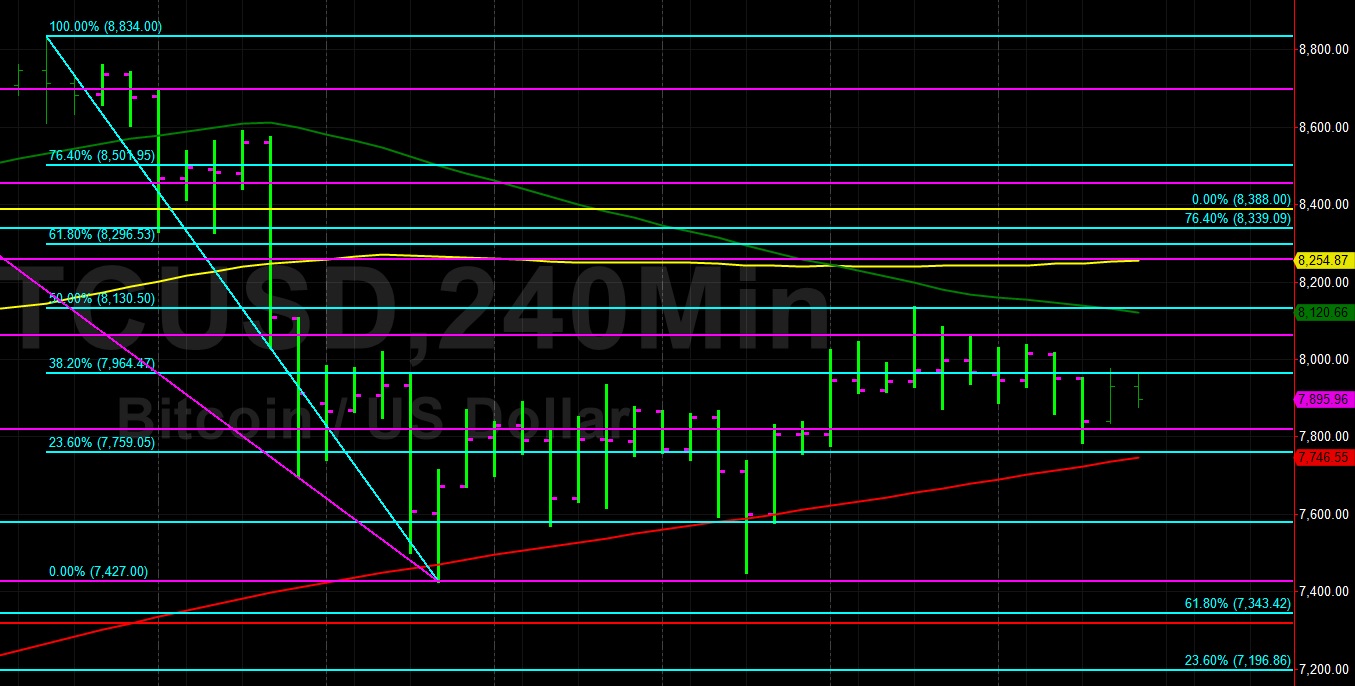
Bitcoin (BTC/USD) traded sideways early in today’s Asian session as the pair reached the 7975.80 area and was supported around the 7833.64 area, having calmly drifted lower from Friday’s high print of 8134.29. BTC/USD continues to exhibit an inability to gain much traction at or above the 8062.27 area, representing the 38.2% retracement of the move from 9090.00 to 7427.00. This signifies the importance of this range, and also explains why the pair did not get too far below the 7819.47 area during yesterday’s North American session, representing the 23.6% retracement of the same range.
The 200-bar MA (4-hourly) continues to approach price activity from below the current market range, and is currently indicating around the 7746.58 area. There are a couple of additional ranges that chartists are watching. First, the move lower from 8834.00 to 7427.00 is relevant, and price has recently traded between its 50% retracement level at 8130.50 and its 23.6% retracement level at 7759.05. If BTC/USD moves higher, traders will pay close attention to the 8298.53 area, its 61.8% retracement level. Technicians are also paying close attention to the move lower from 9090.00 to 7427.00. Bears are looking to see if a decisive break can be made below the 7819.47 area, and Bulls are looking to see if a move can be sustained above the 8062.27 area.
Price activity is nearest the 200-bar MA (4-hourly) at 7746.58 and the 50-bar MA (Hourly) at 7935.13.
Technical Support is expected around 7343.17/ 7187.64/ 6881.34 with Stops expected below.
Technical Resistance is expected around 8230.98/ 8566.38/ 8761.96 with Stops expected above.
On 4-Hourly chart, SlowK is Bearishly below SlowD while MACD is Bullishly above MACDAverage.
On 60-minute chart, SlowK is Bearishly below SlowD while MACD is Bearishly below MACDAverage.
Ethereum
Ethereum (ETH/USD) weakened early in today’s Asian session as the pair came off to the 241.00 figure after being pressured lower during yesterday’s European and North American sessions. The pair was challenged around the 250.59 area in yesterday’s price activity and gradually drifted lower before testing the 241.17 area multiple times, representing the 61.8% retracement of the move from 233.00 to 254.40. ETH/USD Bears are anticipating some Stops below the 238.05 area, representing the 76.4% retracement of the same range.
Chartists are also again paying close attention to the 240.34 area, representing the 38.2% retracement of the 162.00 – 288.77 range. Related downside areas of technical Support include the 225/ 210/ 191 levels and a related area of upside technical Resistance is the 258 area. If ETH/USD is going to resume some of its recent upward price trajectory, it must make a break above the 254.30 level, representing the 38.2% retracement of the move from 288.77 to 233.00. Related upside levels that chartists are watching include the 260.89 and 267.47 levels.
Price activity is nearest the 200-bar MA (4-hourly) at 236.60 and the 100-bar MA (Hourly) at 245.83.
Technical Support is expected around 233.21 / 217.55/ 209.75 with Stops expected below.
Technical Resistance is expected around 248.95/ 258.80/ 266.75 with Stops expected above.
On 4-Hourly chart, SlowK is Bearishly below SlowD while MACD is Bearishly below MACDAverage.
On 60-minute chart, SlowK is Bearishly below SlowD while MACD is Bearishly below MACDAverage.
Investment Disclaimer