
Published
4 years ago on
July 26, 2019
Bitcoin
Bitcoin (BTC/USD) softened in today’s early Asian session as traders moved the pair lower to the 9,914.75 area after falling below the 9,938.16 area during yesterday’s North American session, an important level that represents the 61.8% retracement of the move from 7,508.77 to 13,868.44. BTC/USD escalated higher to the 10,184.99 area during yesterday’s Asian session and tested the 50-bar MA (4-hourly). The 10,087.62 area was toppish later in yesterday’s North American session. The pair continues to trade below the 50-bar MA (4-hourly) and trade between the 50-bar MA (hourly) and 100-bar MA (hourly).
Technicians note that BTC/USD found technical Support around the 9,532.39 area, representing the 38.2% retracement of the move from 19,891.99 to 3,128.89. Given the market’s reaction this area, chartists are eyeing the 7,084.98 area as downside technical Support. Following the pair’s ongoing retracement lower, chartists are eyeing some downside price extension objectives including the 9,146 and 8,694 areas, followed by the 8,604 level.
Price activity is nearest the 50-bar MA (4-hourly) at 10,232.40 and the 100-bar MA (Hourly) at 10,104.18.
Technical Support is expected around 9,285.48/ 9,071.00/ 8,488.00 with Stops expected below.
Technical Resistance is expected around 10,268.07/ 10,508.20/ 10,958.60 with Stops expected above.
On 4-Hourly chart, SlowK is Bearishly below SlowD while MACD is Bullishly above MACDAverage.
On 60-minute chart, SlowK is Bullishly above SlowD while MACD is Bearishly below MACDAverage.
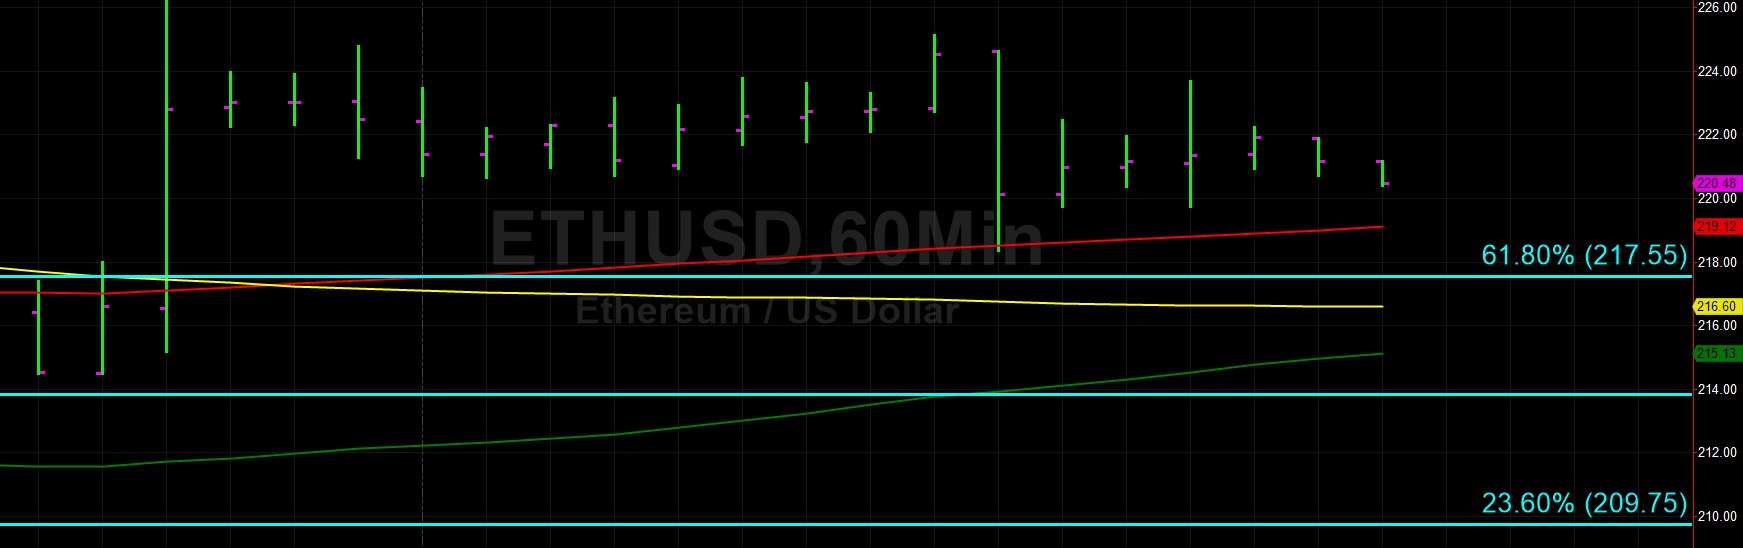
Ethereum
Ethereum (ETH/USD) was marginally weaker early in today’s Asian session as the pair traded as low as the 219.75 area after stalling around the 226.22 area during yesterday’s Asian session. Notably, the 226.56 area is an important recent relative low that anchored the pair’s eventual move to 364.48 on the upside, and many traders will retain their bearish views as long as market activity continues to trade below this area. ETH/USD also continues to orbit the 222.55 area, representing the 50% retracement of the move from 80.70 to 364.49.
ETH/USD bears are again eyeing the 202.27 area, a level that was tested on Wednesday that represents the 61.8% retracement of the move from 148.81 to 288.77. During yesterday’s North American session, traders tested the 200-bar MA (hourly), and market activity continues to trade above the 200-bar MA (hourly), 100-bar MA (hourly), and the 50-bar MA (hourly). Technicians are paying attention to some downside price extension objectives including the 195.31 and 170.14 areas.
Price activity is nearest the 50-bar MA (4-hourly) at 219.28 and the 200-bar MA (Hourly) at 219.12.
Technical Support is expected around 201.38/ 191.40/ 183.33 with Stops expected below.
Technical Resistance is expected around 229.46/ 233.00/ 242.85 with Stops expected above.
On 4-Hourly chart, SlowK is Bearishly below SlowD while MACD is Bullishly above MACDAverage.
On 60-minute chart, SlowK is Bearishly below SlowD while MACD is Bearishly below MACDAverage.
Investment Disclaimer


