Published
4 years ago on
July 27, 2019
Litecoin
Litecoin (LTC/USD) continues to trade below a key technical level as negative sentiment continues to keep the pair capped around the psychologically-important 100.00 figure. The 107.27 area is an important technical level and the pair’s inability to move above it mid-month saw traders trigger Stops below the 83.34 area, an important downside price extension objective that corresponds to the pair’s recent high of 145.97. If additional bearish sentiment develops, LTC/USD traders will eye additional an additional downside price extension objective around the 63.99 area.
The 50-bar MA (4-hourly) and the 100-bar MA (4-hourly) are converging and if the 50-bar MA (4-hourly) crosses above, it could indicate a reverse in sentiment and some bullish price behaviour. Likewise, the 50-bar MA (hourly), 100-bar MA (hourly), and 200-bar MA (hourly) are all trading near each other, suggesting the market is looking for additional direction. Chartists continue to eye the 94.81 area and the 91.34 area, representing the 38.2% and 50% retracements of the recent 76.63 – 106.04 range.
Price activity is nearest the 50-bar MA (4-hourly) at 95.62 and the 100-bar MA (Hourly) at 93.91.
Technical Support is expected around 91.34/ 87.86/ 83.57 with Stops expected below.
Technical Resistance is expected around 99.10/ 106.04/ 112.72 with Stops expected above.
On 4-Hourly chart, SlowK is Bearishly below SlowD while MACD is Bullishly above MACDAverage.
On 60-minute chart, SlowK is Bullishly above SlowD while MACD is Bearishly below MACDAverage.
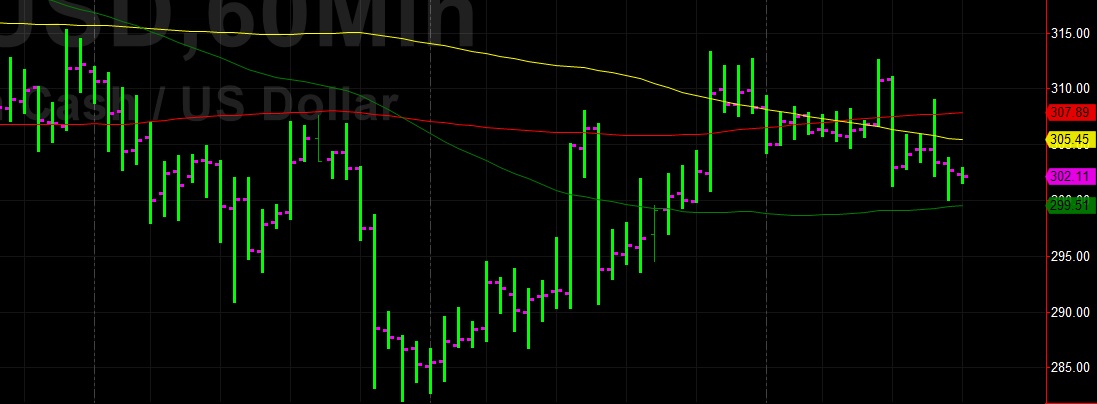
Bitcoin Cash
Bitcoin Cash (BCH/USD) is trading around some important technical levels as traders continue to test the 288 and 300 areas, both of which represent important downside price extension objective levels that related to the late-June high of 515.85. The relevance of 288.15 was technically confirmed in the middle of the month when sizable Stops were elected below this area, driving the pair lower to the 255.06 area, its weakest showing since late April.
Technicians are also monitoring the behaviour of prices around the 289.04 and 310.02 areas, representing the 38.2% and 61.8% retracements of the move between 255.06 and 344.00. Price activity continues to hover around the 50-bar MA (4-hourly), and the 50-bar (MA) and 100-bar (MA) continue to converge. Also, the 50-bar MA (hourly) continues to trade below the 100-bar MA (hourly) and 200-bar MA (hourly). If additional negative sentiment develops, the 276.05 area will take on greater importance, with the 255 and 237 areas representing additional downside targets.
Price activity is nearest the 50-bar MA (4-hourly) at 308.26 and the 50-bar MA (Hourly) at 299.50.
Technical Support is expected around 275.42/ 262.40/ 237.83 with Stops expected below.
Technical Resistance is expected around 323.01/ 331.64/ 344.09 with Stops expected above.
On 4-Hourly chart, SlowK is Bearishly below SlowD while MACD is Bullishly above MACDAverage.
On 60-minute chart, SlowK is Bearishly below SlowD while MACD is Bearishly below MACDAverage.
Investment Disclaimer