Published
4 years ago on
July 03, 2019
Bitcoin
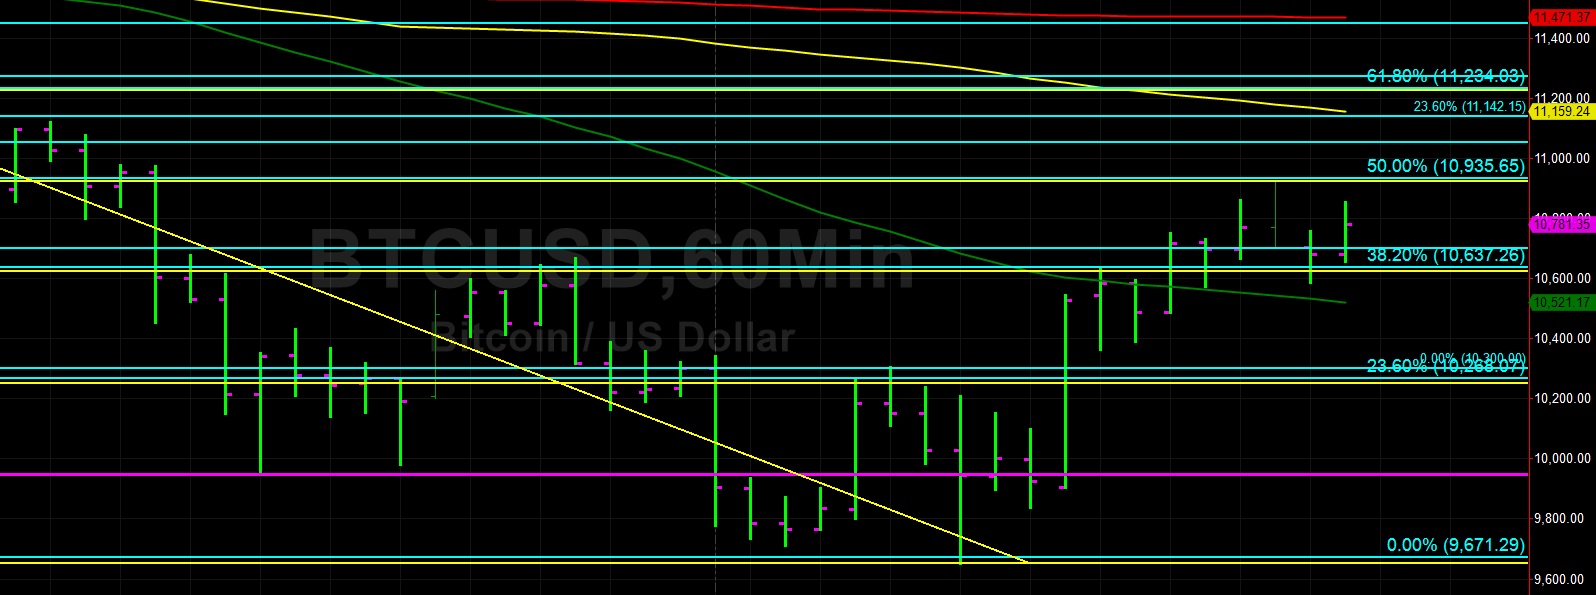
Bitcoin (BTC/USD) moved higher early in today’s Asian session and traded as high as the 10925.00 level before ceding some ground and moving back to the 10589 area. During yesterday’s North American session, the pair moved back above the 50-bar MA (4-hourly), and then Bids emerged around the 50-bar MA (4-hourly) at 10564 during a pullback. While the pair was consolidating recent gains below the 50-bar MA (4-hourly), it traded as low as the 9651 area during yesterday’s North American session, just below a downside price extension price objective around the 9671 level.
Early in today’s Asian session during BTC/USD’s move higher, the pair tested the 50% retracement of the recent 12,200 – 9651 range and then moved lower. Stops are likely in place above the 10,935.65 area, and then Stops are also likely in place above the 11,234 area. Above current market activity, the 100-bar MA (4-hourly) is indicating around the 11,158.77 area, and the 200-bar MA (4-hourly) is indicating around the 11,471.21 area. Below current market activity, the 10,268.07 area represents potential technical Support.
Price activity is nearest the 100-bar MA (4-hourly) at 10,636.82 and the 50-bar MA (Hourly) at 10,520.91.
Technical Support is expected around 10,137.67/ 9953.00/ 9765.93 with Stops expected below.
Technical Resistance is expected around 11,234.03/ 11,663.14/ 12,084.22 with Stops expected above.
On 4-Hourly chart, SlowK is Bullishly above SlowD while MACD is Bullishly above MACDAverage.
On 60-minute chart, SlowK is Bearishly below SlowD while MACD is Bullishly above MACDAverage.
Ethereum
Ethereum (ETH/USD) gained ground early in today’s Asian session and traded as high as the 291.08 area after finding Bids around the 285 level, representing the 38.2% retracement of the move from 157.28 – 364.49 range. During yesterday’s European session, the pair traded as low as 270.42 after Stops were elected below the 272.56 area, representing the 23.6% retracement of the move from 894.00 to 80.60. Chartists cite technical Resistance around the 293 – 294 range, with the 100-bar MA (4-hourly) indicating around the 294.88 area.
Above current market activity, the 302.20 area represents a relative historical high and the 50-bar MA (4-hourly) is currently indicating around the 306.06 level. Also, the 100-bar MA (hourly) is indicating around the 297.18 area and the 200-bar MA (hourly) is indicating around the 306.08 level. The 306.35 level represents the 38.2% retracement of the 364.49 – 270.42 range. Below current market activity, Bids are likely in place between the 257 – 263 areas.
Price activity is nearest the 100-bar MA (4-hourly) at 294.88 and the 50-bar MA (Hourly) at 287.80.
Technical Support is expected around 272.56/ 249.90/ 226.56 with Stops expected below.
Technical Resistance is expected around 314.00/ 322.16/ 329.73 with Stops expected above.
On 4-Hourly chart, SlowK is Bullishly above SlowD while MACD is Bullishly above MACDAverage.
On 60-minute chart, SlowK is Bullishly above SlowD while MACD is Bullishly above MACDAverage.
Investment Disclaimer