
Published
4 years ago on
July 05, 2019
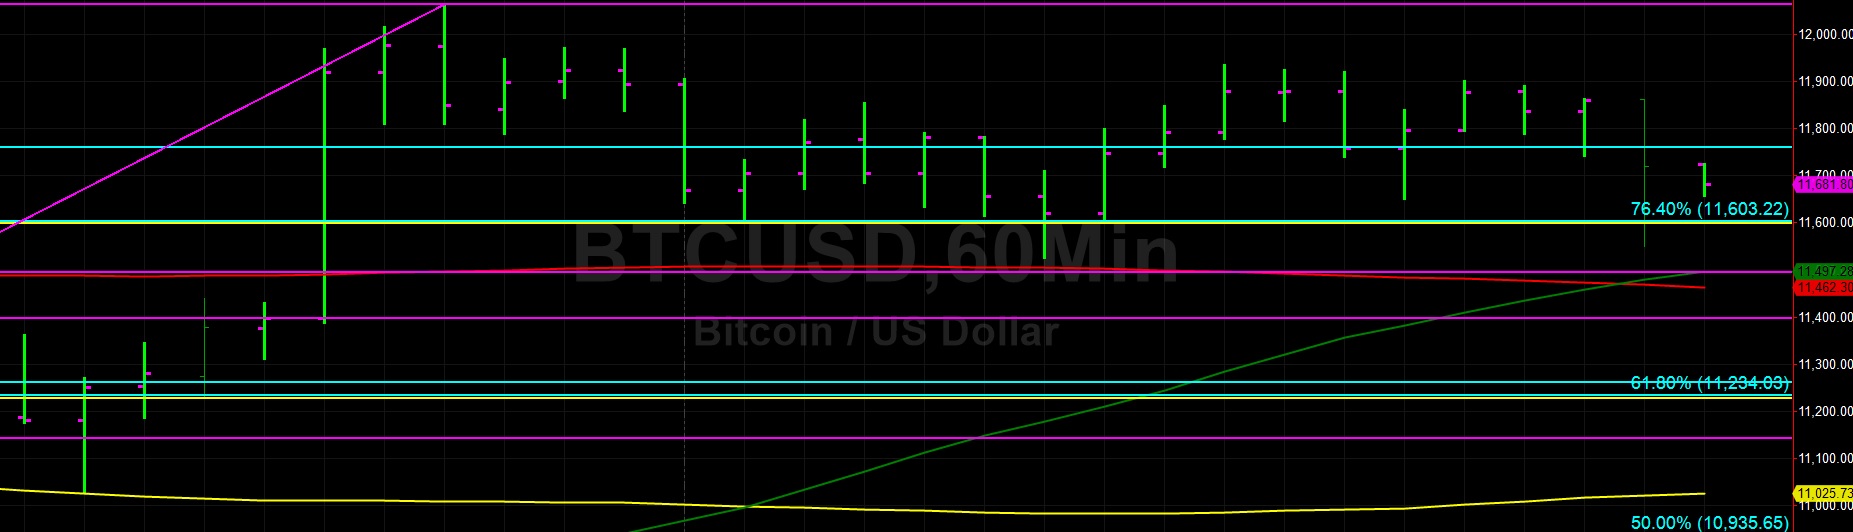
Bitcoin
Bitcoin (BTC/USD) continued to trade sideways early in today’s Asian session as the pair dropped to the 11,551.00 level after trading as high as the 12,064.26 area in yesterday’s Asian session. The brief move above the psychologically-important 12,000 figure represented its first time above this level since 30 June. During yesterday’s European session, the pair moved lower from multi-day highs and tested Bids just above the 50-bar MA (4-hourly), then around the 11,519.82 area. The pair has generally traded sideways ever since the 50-bar MA (hourly) crossed above the 100-bar MA (hourly) early in yesterday’s European session.
BTC/USD recovered during yesterday’s North American session but was capped around the 11,934.87 area, just below the 76.4% retracement of the move from 12,064.26 to 11,526.56. Below current market activity, chartists are anticipating some technical Support around the 11,494.73 area, representing the 23.6% retracement of the 9651 – 12,064.26 range. Just below that level, the 50-bar MA (hourly) is indicating around the 11,475.89 area, and Stops are likely in place below this level. Technicians also anticipate some buying demand around the 11,234 – 11,494 range.
Price activity is nearest the 50-bar MA (4-hourly) at 11,466.27 and the 50-bar MA (Hourly) at 11,477.47.
Technical Support is expected around 10,857.63/ 10,638.50/ 10,137.67 with Stops expected below.
Technical Resistance is expected around 12,084.22/ 12,257.38/ 12,700.54 with Stops expected above.
On 4-Hourly chart, SlowK is Bearishly below SlowD while MACD is Bullishly above MACDAverage.
On 60-minute chart, SlowK is Bearishly below SlowD while MACD is Bearishly below MACDAverage.
Ethereum
Ethereum (ETH/USD) depreciated early in today’s Asian session as the pair traded as low as the 291.44 area, right around the 38.2% retracement of the move from 324.50 to 271.12. During yesterday’s Asian session, the pair traded as high as the 304.00 level, right around the 50-bar MA (4-hourly) and also right around the 61.8% retracement of the move from 324.50 to 271.12. Some Stops were elected above the 302.20 area during yesterday’s move higher, a level that represents a previous relative historical high.
ETH/USD currently has a short-term downward bias, and additional consolidation could see some additional important areas tested including the 289.64 area, representing the 38.2% retracement of the move from 627.83 to 80.60. Below that area, the 285.34 area is the 38.2% retracement of the 157.28 – 364.49 range and the 283.72 level represents the 23.6% retracement of the move from 324.50 to 271.12. Chartists anticipate a series of Bids between the 280 – 283 levels.
Price activity is nearest the 100-bar MA (4-hourly) at 297.86 and the 100-bar MA (Hourly) at 291.73.
Technical Support is expected around 272.56/ 249.90/ 226.56 with Stops expected below.
Technical Resistance is expected around 314.00/ 322.16/ 329.73 with Stops expected above.
On 4-Hourly chart, SlowK is Bearishly below SlowD while MACD is Bullishly above MACDAverage.
On 60-minute chart, SlowK is Bearishly below SlowD while MACD is Bearishly below MACDAverage.
Investment Disclaimer


