Published
4 years ago on
July 06, 2019
Bitcoin
Bitcoin (BTC/USD) moved lower early in today’s Asian session as the pair traded as low as the 10,802.00 area after fading from the 11,449.51 level during yesterday’s North American session. The intraday low early in today’s Asian session is just below the 61.8% retracement of the range from 8919.72 – 13,868.44, and the next important downside level in that range is 10,087.62. The pair experienced a sizable decline early in yesterday’s Asian session, declining from the 11,862.20 area to the 11,035.01 level, a depreciation that accelerated after Stops were elected below the 50-bar MA (4-hourly) around the 11,456.47 level.
The 50-bar MA (4-hourly) and the 100-bar MA (4-hourly) are converging and it could be a bearish indication if the 100-bar MA (4-hourly) crosses above the 50-bar MA (4-hourly). The 50-bar MA (4-hourly) has been above the 100-bar MA (4-hourly) since 16 June when BTC/USD was trading below the psychologically-important 10,000 figure. The 10,624.72 level and 10,252.56 level are important areas that will closely be watched for relevance as technical Support during a pullback lower, and represent retracement levels related to the recent 12,200 – 9,651 range. Stops are expected below other retracement areas including the 10,857/ 10,572/ 10,220 levels.
Price activity is nearest the 100-bar MA (4-hourly) at 11,041.78 and the 100-bar MA (Hourly) at 11,111.65.
Technical Support is expected around 10,638.50/ 10,137.67/ 9,651.00 with Stops expected below.
Technical Resistance is expected around 11,598.44/ 12,084.22/ 12,257.38 with Stops expected above.
On 4-Hourly chart, SlowK is Bearishly below SlowD while MACD is Bearishly below MACDAverage.
On 60-minute chart, SlowK is Bearishly below SlowD while MACD is Bearishly below MACDAverage.
Ethereum
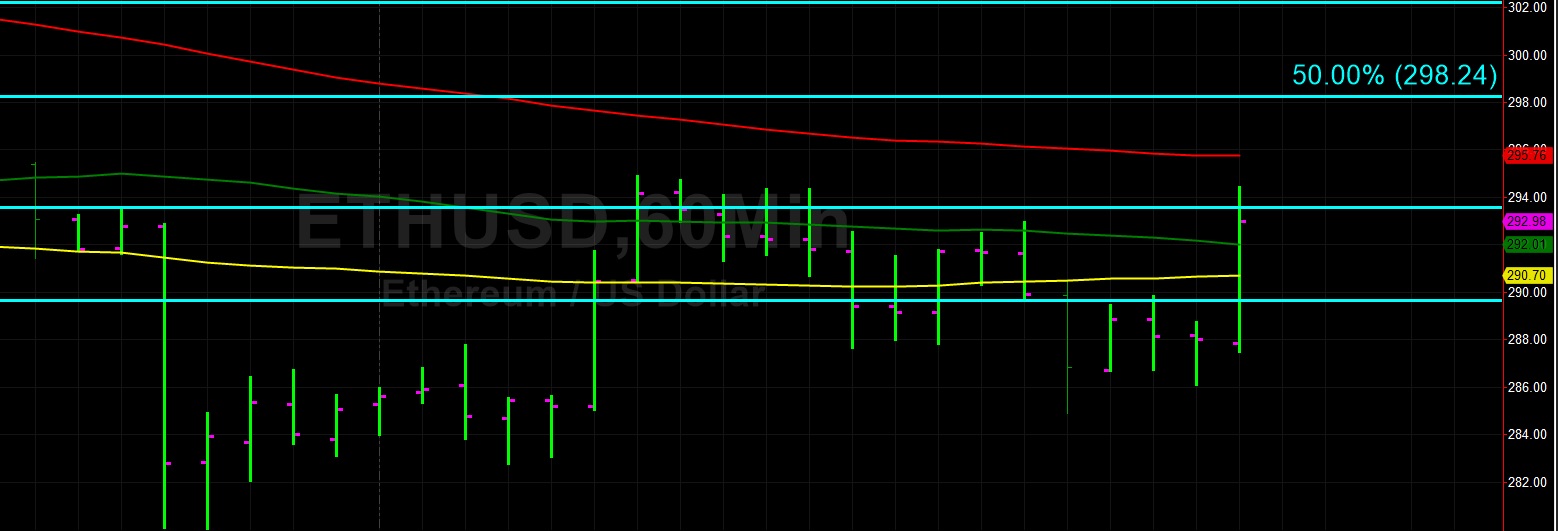
Ethereum (ETH/USD) depreciated early in today’s Asian session as the pair traded as low as the 284.90 level after peaking around the 294.90 area during yesterday’s European session. ETH/USD fell sharply during yesterday’s Asian session, trading as low as the 280.10 level, just below the 280.32 level that represents the 38.2% retracement of the move from 144.15 to 364.49. The next downside price level related to this range is the 273.22 area. Early in yesterday’s European session, the 100-bar MA (4-hourly) crossed above the 50-bar MA (4-hourly), and that could result in additional weakness in the pair.
The 200-bar MA (4-hourly) has been supportive of ETH/USD, and is currently indicating around the 276.71 level. Technicians anticipate Bids around the 272 – 273 levels, with stronger Bids expected around the 257 – 263 areas, Notably, the 257.22 level represents the 23.6% retracement of the 828.87 – 80.60 range. If ETH/USD is able to rally above current prices, traders will again examine the 302.20 area, representing a relative historical high. Some price congestion is also expected between the 315 – 319 levels.
Price activity is nearest the 50-bar MA (4-hourly) at 295.52 and the 200-bar MA (Hourly) at 295.76.
Technical Support is expected around 272.56/ 249.90/ 226.56 with Stops expected below.
Technical Resistance is expected around 314.00/ 322.16/ 329.73 with Stops expected above.
On 4-Hourly chart, SlowK is Bullishly above SlowD while MACD is Bullishly above MACDAverage.
On 60-minute chart, SlowK is Bullishly above SlowD while MACD is Bullishly above MACDAverage.
Investment Disclaimer