Published
4 years ago on
July 08, 2019
Bitcoin
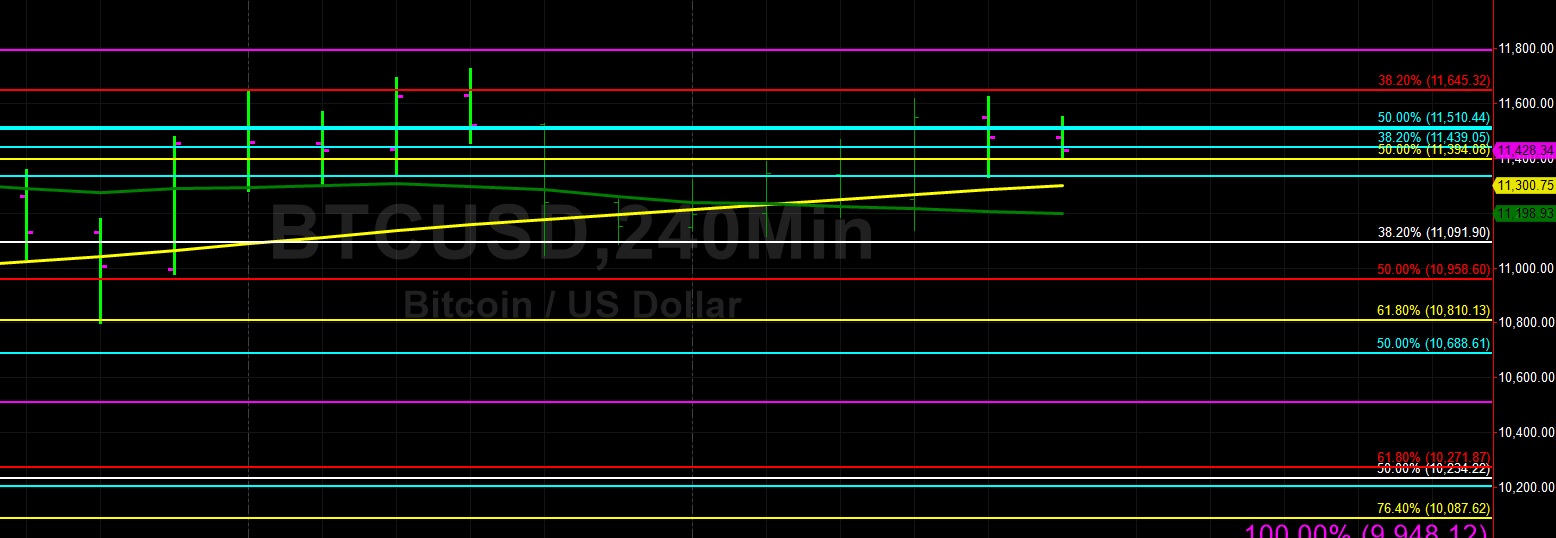
Bitcoin (BTC/USD) appreciated marginally early in today’s Asian session as the pair traded as high as the 11,547.23 level after steadily moving higher since yesterday’s Asian session. The pair has generally remained above the 11,091.90 area during this time frame, representing the 38.2% retracement of the move from 6,600 to 13,868.44. The next key level above current market activity related to this range is the 12,153.09 area, and the next key level below current market activity related to this range is the 10,234.22 level.
During yesterday’s European session, the 100-bar MA (4-hourly) crossed above the 50-bar MA (4-hourly), a potentially bearish development. Late in yesterday’s North American session, BTC/USD stopped just short of testing the 11,645.32 area, representing the 38.2% retracement of the 8,048.75 – 13,868.44 range. The 12,494.99 level is the next upside target related to the same range. Chartists also anticipate a variety of Offers between the 12,153 and 12,367 areas.
Price activity is nearest the 100-bar MA (4-hourly) at 11,301.46 and the 100-bar MA (Hourly) at 11,416.34.
Technical Support is expected around 10,638.50/ 10,137.67/ 9,651.00 with Stops expected below.
Technical Resistance is expected around 11,978.03/ 12,084.22/ 12,257.38 with Stops expected above.
On 4-Hourly chart, SlowK is Bullishly above SlowD while MACD is Bullishly above MACDAverage.
On 60-minute chart, SlowK is Bearishly below SlowD while MACD is Bullishly above MACDAverage.
Ethereum
Ethereum (ETH/USD) lost ground early in today’s Asian session as the pair fell to the 305.44 area after peaking around the 310.70 area late in yesterday’s North American session. Notably, ETH/USD rocketed from the 290.15 area to the 309.56 area during yesterday’s North American session, with some Stops elected above the 306.99 area, representing the 38.2% retracement of the move from 366.15 to 270.42. This is the first time the market has traded above this important level since 30 June, and the next upside target related to this range is 318.28.
During the pullback during yesterday’s Asian session, ETH/USD tested the 283.87 area, representing the 23.6% retracement of the move from 324.50 to 271.12. The 311.90 level is the next upside target related to this range. Technicians anticipate Bids between the 281 – 285 area, and Offers are expected between the 315 – 318 area. The 50-bar MA (hourly), 100-bar MA (hourly), and 200-bar MA (hourly) are converging and are now indicating around the 292 – 294 areas.
Price activity is nearest the 100-bar MA (4-hourly) at 302.04 and the 200-bar MA (Hourly) at 294.09.
Technical Support is expected around 272.56/ 249.90/ 226.56 with Stops expected below.
Technical Resistance is expected around 314.00/ 322.16/ 329.73 with Stops expected above.
On 4-Hourly chart, SlowK is Bullishly above SlowD while MACD is Bullishly above MACDAverage.
On 60-minute chart, SlowK is Bearishly below SlowD while MACD is Bullishly above MACDAverage.
Investment Disclaimer