Published
4 years ago on
August 01, 2019
Bitcoin
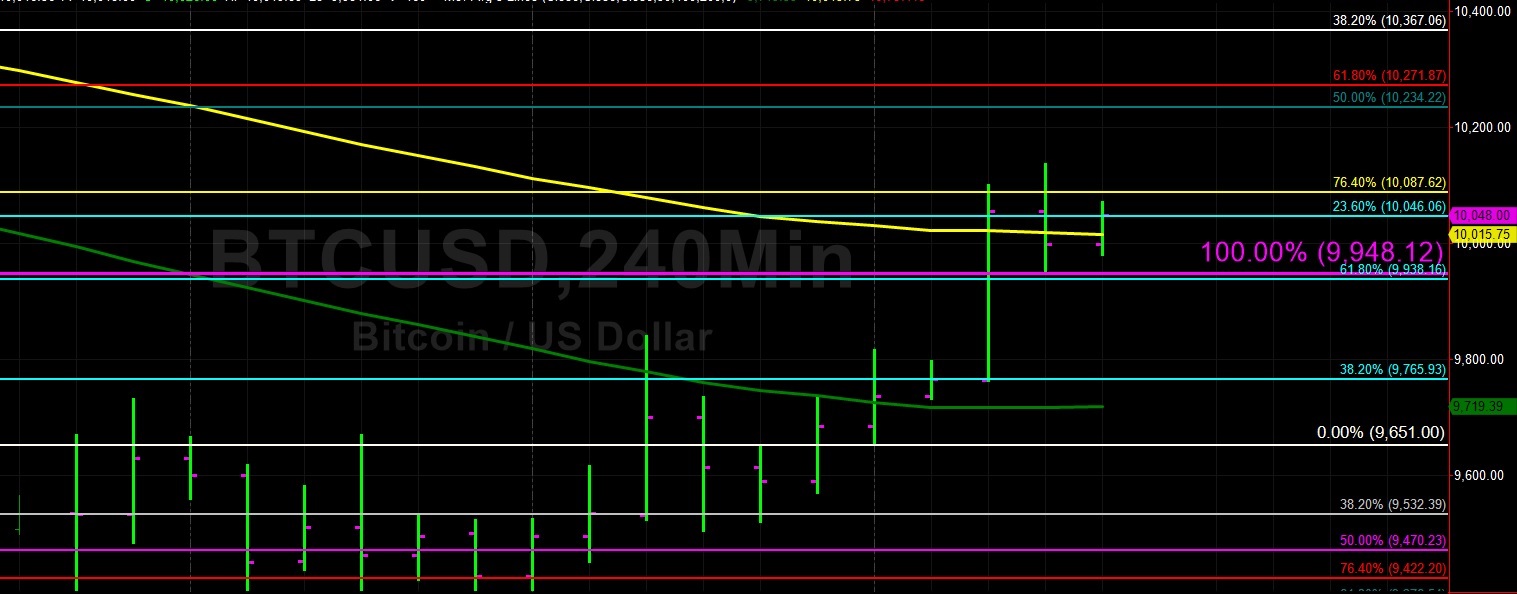
Bitcoin (BTC/USD) extended recent gains early in today’s Asian session as the pair traded as high as the 10,135.12 area following its move back above the psychologically-important 10,000 figure during yesterday’s North American session. Some Bids emerged right around the 50-bar MA (4-hourly) during yesterday’s European session when it was indicating around 9,716 area, and some Stops were elected during yesterday’s North American session when the pair moved above the 100-bar MA (4-hourly). The move higher to levels where BTC/USD bulls may try to establish demand above the 100-bar MA (4-hourly) may provide it with the catalyst to test the 200-bar MA (4-hourly).
Another bullish development took place yesterday when the 50-bar MA (hourly) crossed above the 100-bar MA (hourly), right around the same time Bids developed around the 200-bar MA (hourly). Technically, the pair’s move above the 9,921 area is significant, as it represented a downside price extension objective that originated with a recent relative high around the 13,202 area. The level’s significance was confirmed several times last month when Stops were elected above and below the area. Chartists are paying very close attention to the 10,548 area as an important upside price extension objective.
Price activity is nearest the 100-bar MA (4-hourly) at 10,015.35 and the 200-bar MA (Hourly) at 9,720.12.
Technical Support is expected around 9,671.29/ 9,442.20/ 9,285.48 with Stops expected below.
Technical Resistance is expected around 10,268.07/ 10,508.20/ 10,958.60 with Stops expected above.
On 4-Hourly chart, SlowK is Bearishly below SlowD while MACD is Bullishly above MACDAverage.
On 60-minute chart, SlowK is Bullishly above SlowD while MACD is Bullishly above MACDAverage.
Ethereum
Ethereum (ETH/USD) gained ground early in today’s Asian session as the pair traded as high as the 218.27 area after traders took aim at the 100-bar MA (4-hourly) during yesterday’s North American session. Bids emerged around the 212.89 area during yesterday’s North American session, right around the 50-bar MA (4-hourly). In addition to the 100-bar MA (4-hourly), ETH/USD will need to contend with additional upside technical Resistance.
Most immediately, the 220.44 level represents the 23.6% retracement of the move from 318.63 to 190.11 and the 222.55 area represents the 50% retracement of the move from 80.60 to 364.49. Chartists anticipate technical Resistance around the 228 – 229 areas, with additional selling pressure expected between the 235 and 239 areas. Above those areas, the 246.88 area represents the 38.2% retracement of the move from 515.88 to 80.60.
Price activity is nearest the 100-bar MA (4-hourly) at 216.35 and the 200-bar MA (Hourly) at 212.98.
Technical Support is expected around 206.18/ 197.56 / 191.40 with Stops expected below.
Technical Resistance is expected around 222.55/ 229.46/ 233.00 with Stops expected above.
On 4-Hourly chart, SlowK is Bullishly above SlowD while MACD is Bullishly above MACDAverage.
On 60-minute chart, SlowK is Bullishly above SlowD while MACD is Bullishly above MACDAverage.
Investment Disclaimer