Published
4 years ago on
August 13, 2019
Bitcoin
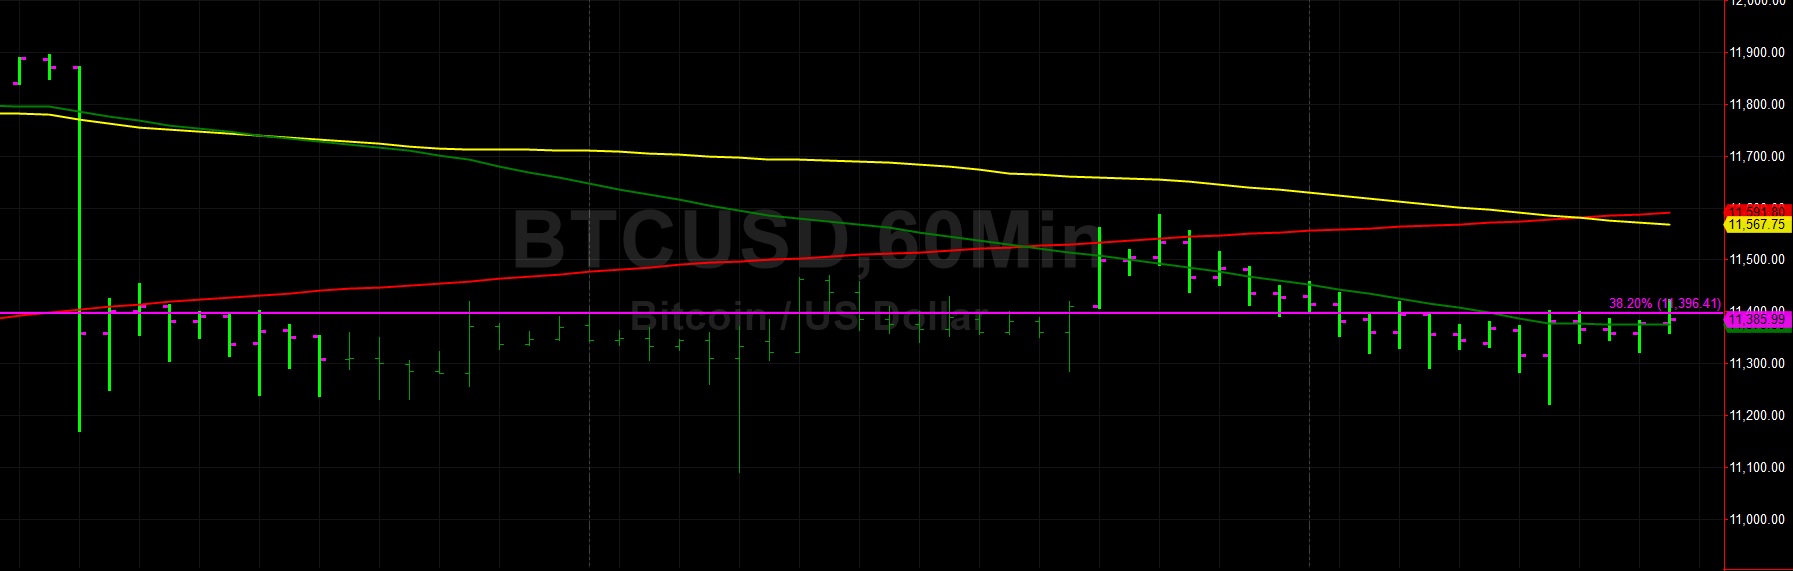
Bitcoin (BTC/USD) hovered around some important technical levels early in today’s Asian session as the pair continued to trade in a narrow range, much as it has over the past several trading sessions. Traders briefly pushed BTC/USD above the 50-bar MA (4-hourly) during yesterday’s Asian session before it receded back below the 11,262.06 area during yesterday’s European session, a level that represents the 38.2% retracement of the move from 13,868.44 to 9,651.00.
Bids emerged around the 11,222.40 area during the retracement higher, just above the 76.4% retracement of the move from 11,088.88 to 11,585.00. The pair continues to trade between the 50-bar MA (4-hourly) and 100-bar MA (4-hourly), and it continues to hug its 50-bar MA (hourly). One area that BTC/USD has not deviated from for several trading sessions is the 11,396.41 area, representing the 38.2% retracement of the move from 7,427.00 to 13,850.00. The next upside price objective related to this range is the 12,334.17 area and the next downside price objective related to this range is the 10,638.50 area.
Price activity is nearest the 50-bar MA (4-hourly) at 11,599.76 and the 50-bar MA (Hourly) at 11,374.92.
Technical Support is expected around 11,175.35/ 10,688.61/ 10,271.87 with Stops expected below.
Technical Resistance is expected around 12,367.56/ 12,873.12/ 13,488.49 with Stops expected above.
On 4-Hourly chart, SlowK is Bullishly above SlowD while MACD is Bearishly below MACDAverage.
On 60-minute chart, SlowK is Bullishly above SlowD while MACD is Bearishly below MACDAverage.
Ethereum
Ethereum (ETH/USD) found a Bid early in today’s Asian session as traders continued to try to push the pair higher above the psychologically-important 200.00 figure. During yesterday’s North American session, Bids emerged around the 209.75 level, representing the 23.6% retracement of the move from 627.83 to 80.60. ETH/USD has generally been confined to a relatively tight range over the past several trading sessions.
Chartists are observing that the 50-bar MA (4-hourly), 100-bar MA (4-hourly), and 200-bar MA (4-hourly) are converging above current market activity, and this may have a Bearish impact on market sentiment. If selling pressure emerges, technicians will continue to anticipate some technical Support around the 202.27 level, an area where Bids have recently emerged. Below that level, the 197.56 and 191.40 areas are levels where additional technical Support is likely to emerge.
Price activity is nearest the 100-bar MA (4-hourly) at 216.65 and the 100-bar MA (Hourly) at 212.05.
Technical Support is expected around 202.27/ 197.56/ 191.40 with Stops expected below.
Technical Resistance is expected around 222.55/ 229.46/ 239.45with Stops expected above.
On 4-Hourly chart, SlowK is Bearishly below SlowD while MACD is Bullishly above MACDAverage.
On 60-minute chart, SlowK is Bullishly above SlowD while MACD is Bearishly below MACDAverage.
Investment Disclaimer