
Published
4 years ago on
August 15, 2019
Bitcoin
Bitcoin (BTC/USD) gained a little bit of ground early in today’s Asian session as the pair appreciated to the 10,245.67 level after extending recent losses to the psychologically-important 10,000.00 figure during yesterday’s North American session. Stops were elected below the 10,067.62 area during the move lower, representing the 76.4% retracement of the move from 8,919.72 to 13,868.44. Following the pair’s move below the 200-bar MA (4-hourly) during yesterday’s Asian session, traders were unable to push and sustain a move back above the 200-bar MA (4-hourly) during yesterday’s European and North American sessions.
BTC/USD also continues to trade well below its 50-bar MA (hourly), 100-bar MA (hourly), and 200-bar MA (hourly). The 10,638.50 area has been technical Resistance over the last day, representing the 50% retracement of the move from 7,427.00 to 13,850.00. Given the pair’s current weaker bias, traders are identifying some downside price objectives. These include the 9,765, 9.265, and 8,919 areas ahead of the important 8,488 level.
Price activity is nearest the 200-bar MA (4-hourly) at 10,597.18 and the 50-bar MA (Hourly) at 10,825.17.
Technical Support is expected around 9,765.93/ 9,265.49/ 8,919.72 with Stops expected below.
Technical Resistance is expected around 10,367.06/ 10,810.13/ 11,136.82 with Stops expected above.
On 4-Hourly chart, SlowK is Bearishly below SlowD while MACD is Bearishly below MACDAverage.
On 60-minute chart, SlowK is Bullishly above SlowD while MACD is Bearishly below MACDAverage.
Ethereum
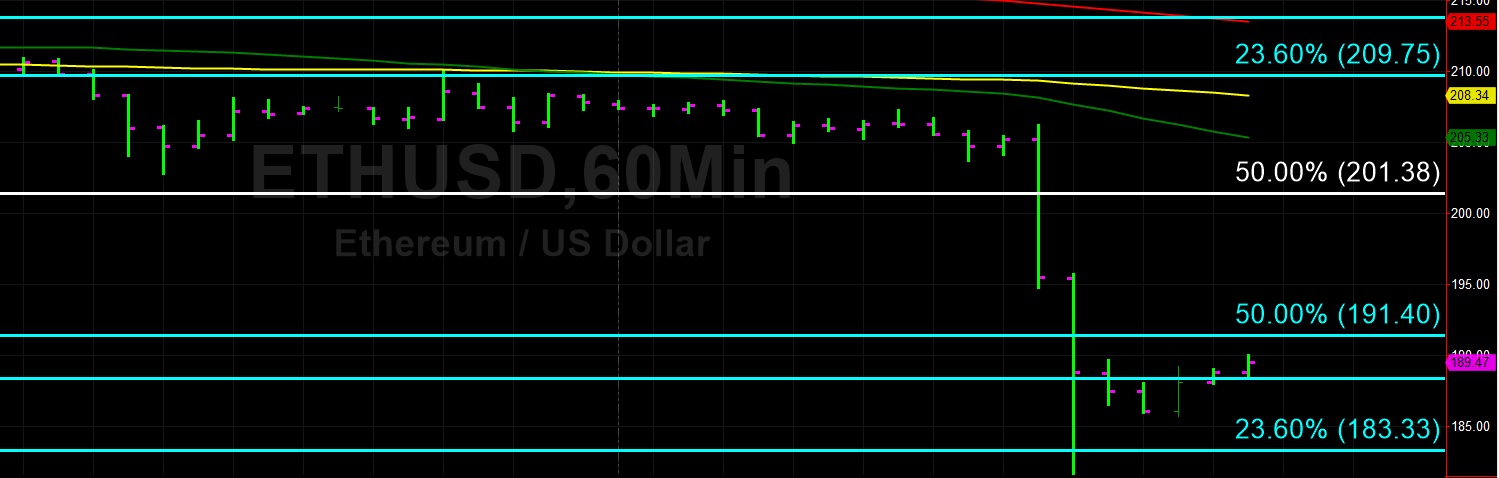
Ethereum (ETH/USD) climbed a little higher early in today’s Asian session but only after a massive depreciation during yesterday’s North American session that saw the pair decline to the 181.60 area, a quick move lower from the 206.19 level. The pair was capped around the 209.75 level during yesterday’s Asian session, an important level that represents the 23.6% retracement of the move from 627.83 to 80.60. Also, the 206.18 level has emerged as technical Resistance.
During the pair’s depreciation during yesterday’s North American session, Bids finally emerged around the 181.84 area, representing the 76.4% retracement of the move from 148.81 to 288.77. ETH/USD clearly has a downward bias, and one level that chartists are now focusing on is the 165.25 area, representing the 38.2% retracement of the move from 302.20 to 80.60. Sizable Stops are thought to be in place below the 181.84 area.
Price activity is nearest the 50-bar MA (4-hourly) at 213.09 and the 50-bar MA (Hourly) at 205.32.
Technical Support is expected around 181.84/ 165.25/ 157.28 with Stops expected below.
Technical Resistance is expected around 197.56/ 206.18/ 217.55 with Stops expected above.
On 4-Hourly chart, SlowK is Bearishly below SlowD while MACD is Bearishly below MACDAverage.
On 60-minute chart, SlowK is Bullishly above SlowD while MACD is Bearishly below MACDAverage.
Investment Disclaimer


