Published
4 years ago on
August 04, 2019
Bitcoin
Bitcoin (BTC/USD) continued to consolidate recent gains below the psychologically-important 11,000 figure following its recent move higher early in today’s Asian session. During yesterday’s European session, the pair again tested and traded above the 10,810.13 area, representing the 61.8% retracement of the move from 8,919.72 to 13,868.44. Market activity then found demand around the 10,688.61 level, representing the 50% retracement of the 7,508.77 – 13,868.44 range. Stronger Bids emerged around the 10,367.06 level, representing the 38.2% retracement of the move from 4,702.53 to 13,868.44.
Additional Bids then emerged later in the Asian session around the 10,508.20 level, itself an important retracement area that represents the 38.2% retracement of the move from 5,072.01 to 13,868.44. The buying demand that is emerging around these key retracement levels is indicative of additional upward price pressure and improving short-term technical market sentiment. Some Stops were elected above the 200-bar MA (4-hourly) during the move higher. Above current market activity, chartists are eyeing a couple of important levels, including the 11,136.82 and 11,262.06 areas.
Price activity is nearest the 200-bar MA (4-hourly) at 10,642.30 and the 50-bar MA (Hourly) at 10,520.07.
Technical Support is expected around 10,046.06/ 9,671.29/ 9,442.20 with Stops expected below.
Technical Resistance is expected around 10,958.60/ 11,136.82/ 11,510.44 with Stops expected above.
On 4-Hourly chart, SlowK is Bearishly below SlowD while MACD is Bullishly above MACDAverage.
On 60-minute chart, SlowK is Bullishly above SlowD while MACD is Bearishly below MACDAverage.
Ethereum
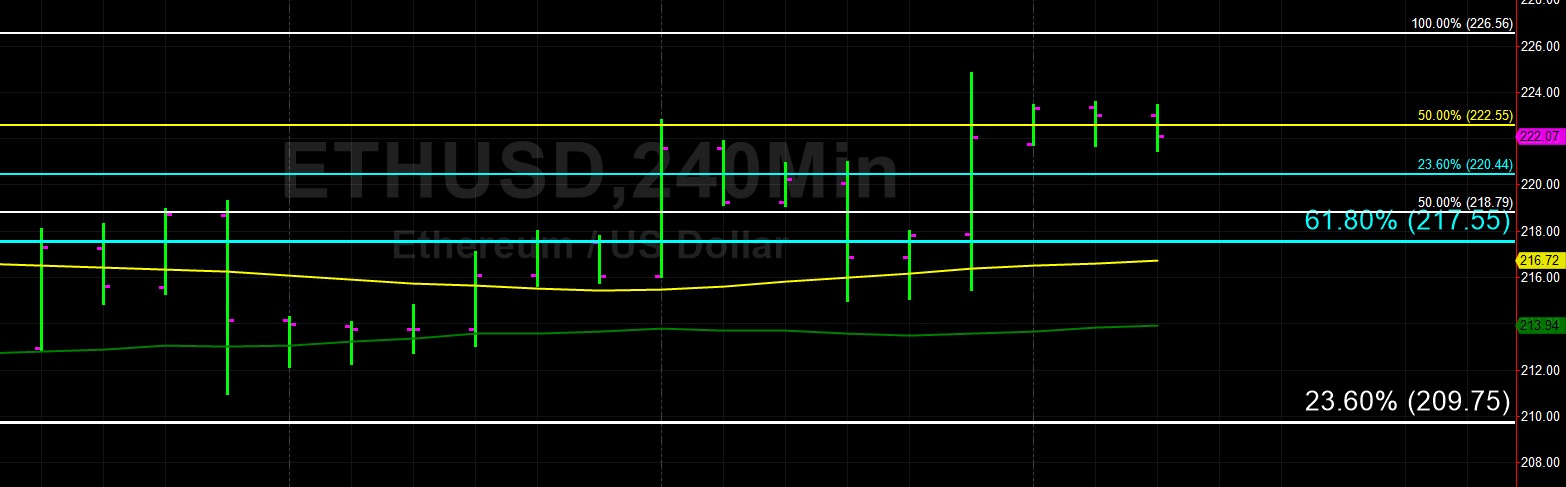
Ethereum (ETH/USD) searched for direction early in the Asian session after continuing to orbit the 222.55 area that represents the 50% retracement of the move from 80.60 to 364.49. The pair has hovered around this area for a few trading sessions following its move above the 50-bar MA (4-hourly) and 100-bar MA (4-hourly). Chartists are now evaluating other levels related to this range with the next upside price objective around the 256.04 area and the range’s next downside price objective around the 189.05 area.
Market activity is still trading well below the 200-bar MA (4-hourly), currently indicating around the 245.54 area. Before ETH/USD may test this area, the pair needs to move through some upside congestion expected between the 226 – 229 area with more Offers anticipated between the 235 – 239 levels. Stronger technical Resistance is expected around the 246 and 249 areas. Below current market activity, the 209.75 level represents the 23.6% retracement of the move from 627.83 to 80.60 and is an important area that the market orbited earlier last week.
Price activity is nearest the 100-bar MA (4-hourly) at 216.72 and the 50-bar MA (Hourly) at 218.98.
Technical Support is expected around 209.75/ 197.56 / 191.40 with Stops expected below.
Technical Resistance is expected around 229.46/ 235.31/ 239.20 with Stops expected above.
On 4-Hourly chart, SlowK is Bullishly above SlowD while MACD is Bullishly above MACDAverage.
On 60-minute chart, SlowK is Bearishly below SlowD while MACD is Bearishly below MACDAverage.
Investment Disclaimer