Published
4 years ago on
August 06, 2019
Bitcoin
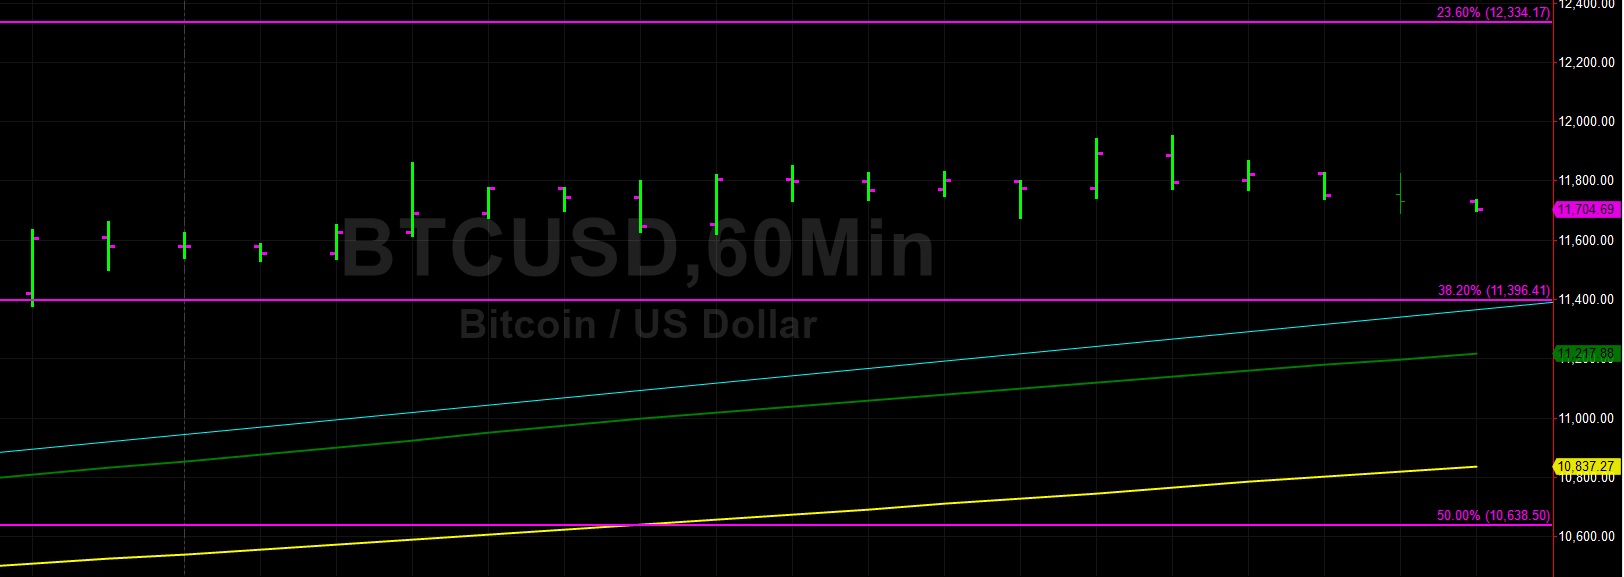
Bitcoin (BTC/USD) continued its surge early in today’s Asian session as the pair moved back to the 11,821.77 area following a pullback from the 11,950.00 level late in yesterday’s North American session. Yesterday’s high represents the pair’s strongest print since 12 July and was just below a technical level that represents the 38.2% retracement of the move from 8,919.72 to 13,868.44. That range’s next upside price objective is the 12,700.54 area. Strong demand emerged during yesterday’s Asian session when the pair sharply climbed from 10,770 to 11,661.
BTC/USD is now trading above its 50-bar MA (4-hourly), 100-bar MA (4-hourly), and 200-bar MA (4-hourly) and is also trading above its 50-bar MA (hourly), 100-bar MA (hourly), and 200-bar MA (hourly). Also, the 50-bar MA (4-hourly) just crossed above the 100-bar MA (4-hourly), a bullish development. The 11,950.79 area represents some upside technical Resistance related to the pair’s recent decline from 13,202.63, and this is an important reason why the market ran out of steam around that level. Additional technical Resistance is expected around the 12,153 and 12,227 areas with the 12,257.38 as an important upside price objective that represents the 61.8% retracement of the move from 13,868.44 to 9,651.00.
Price activity is nearest the 200-bar MA (4-hourly) at 10,683.55 and the 50-bar MA (Hourly) at 11,200.04.
Technical Support is expected around 11,396.41/ 10,688.61/ 10,271.87 with Stops expected below.
Technical Resistance is expected around 11,950.29/ 12,257.38/ 12,873.12 with Stops expected above.
On 4-Hourly chart, SlowK is Bearishly below SlowD while MACD is Bullishly above MACDAverage.
On 60-minute chart, SlowK is Bearishly below SlowD while MACD is Bearishly below MACDAverage.
Ethereum
Ethereum (ETH/USD) encountered some buying pressure early in today’s Asian session as the pair moved back to the 232.80 level following its peak around the 236.90 area during yesterday’s European session. This was the pair’s strongest showing since 14 July, evidencing a renewed bout of positive market sentiment. Notably, the 236.59 area is right around yesterday’s daily high and it represents an important price objective related to July’s depreciation from the 318 level.
Chartists are observing some technical Resistance just above current market activity around the 239.20 level, with the 200-bar MA (4-hourly) indicating immediately above that area around the 241.49 area. The 50-bar MA (4-hourly) and 100-bar MA (4-hourly) have converged, and if traders are able to push ETH/USD above the 200-bar MA (4-hourly), some additional Offers are expected around a couple of important technical levels including the 246 and 249 levels. Below current market activity, technicians are eyeing the 222.55 area, representing the 50% retracement of the move from 80.60 – 364.49.
Price activity is nearest the 200-bar MA (4-hourly) at 241.49 and the 50-bar MA (Hourly) at 225.64.
Technical Support is expected around 217.55/ 209.75/ 197.56 with Stops expected below.
Technical Resistance is expected around 239.20/ 246.88/ 257.22 with Stops expected above.
On 4-Hourly chart, SlowK is Bearishly below SlowD while MACD is Bullishly above MACDAverage.
On 60-minute chart, SlowK is Bearishly below SlowD while MACD is Bearishly below MACDAverage.
Investment Disclaimer