Published
4 years ago on
September 28, 2019
Bitcoin
Bitcoin (BTC/USD) appreciated to the 8049.15 area early in today’s Asian session as sentiment continues to worsen following the pair’s sharp declines this week that saw the 10000 figure give way before some important areas of technical Support also yielded ground. Stops were reached below the 8203.91 area late in the week and these saw BTC/USD skid to a fresh multi-month low around the 7712.45 area. The new round of BTC weakness is spotlighting some news areas of potential technical Support, including the 8341.79 area that represents the 23.6% retracement of the 10379.15 – 7712.45 range. The pair continues to trade below its 50-bar MA (4-hourly), 100-bar MA (4-hourly), and 200-bar MA (4-hourly).
There is now major focus on downside price objectives that could be tested if BTC/USD continues to decline further. One such level is the 7343.17 area, representing the 61.8% retracement of the 9948.12 – 3128.89 range, while the 7223.25 area is the 76.4% retracement of the 8488.00 – 3128.89 range. Another very important level that traders are watching is the 6865.68 area, representing the 76.4% retracement of the 4702.53 – 13868.44 range. Below that area, traders will pay close attention to the 6440 and 5808 areas.
Price activity is nearest the 50-bar MA (4-hourly) at 9,516.37 and the 50-bar MA (Hourly) at 8,355.84.
Technical Support is expected around 8,055.91/ 7,508.77/ 7,223.25 with Stops expected below.
Technical Resistance is expected around 9,071.00/ 9,651.00/ 10,097.80 with Stops expected above.
On 4-Hourly chart, SlowK is Bullishly above SlowD while MACD is Bearishly below MACDAverage.
On 60-minute chart, SlowK is Bullishly above SlowD while MACD is Bullishly above MACDAverage.
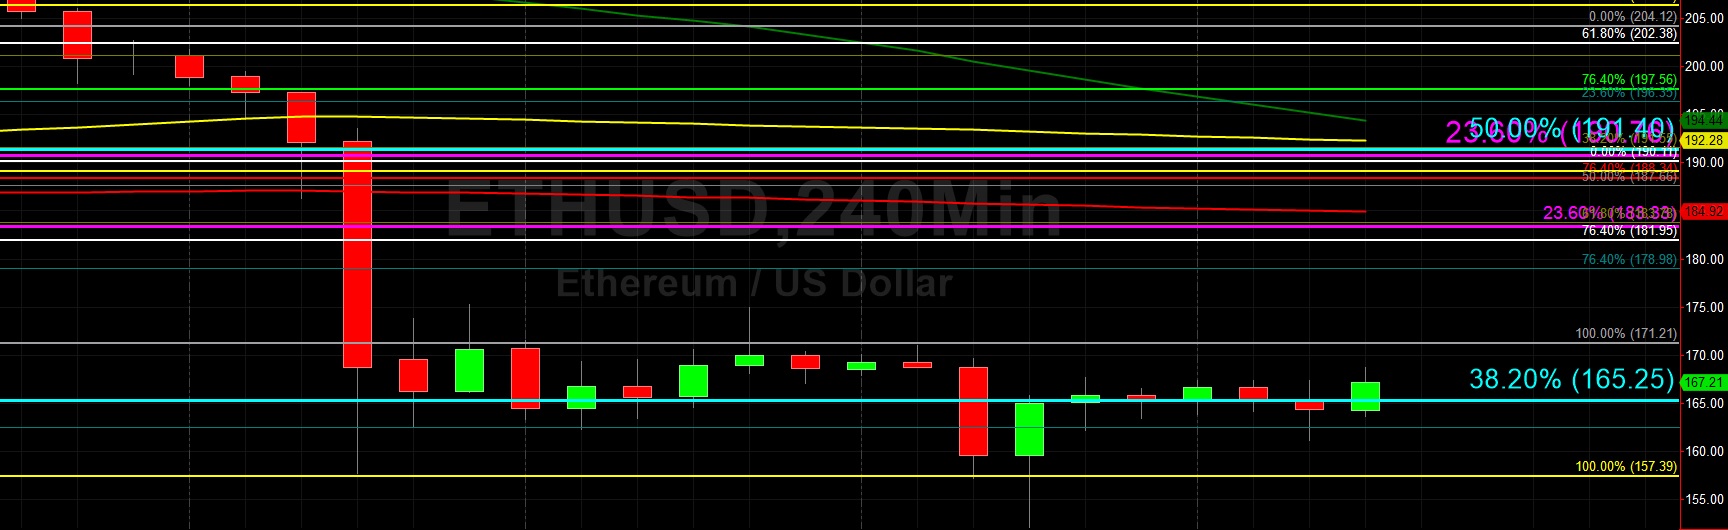
Ethereum
Ethereum (ETH/USD) appreciated to the 168.69 level early in today’s Asian session as traders maintained their focus on a possible test of the 150.00 figure following this week’s abrupt decline below the psychologically-important 200.00 figure. The pair’s time above the 200.00 figure this month was short-lived as traders were unable to push the pair above the 224.71 level and then a dramatic reassessment of market risk caused the pair to tumble to multi-month lows. Negative market sentiment is likely to persist and lead to a continued reduction in long positions and increase in short positions.
ETH/USD is orbiting its 50-bar MA (hourly) but is otherwise trading well below its 100-bar MA (hourly), 200-bar MA (hourly), 50-bar MA (4-hourly), 100-bar MA (4-hourly), and 200-bar MA (4-hourly). If the 150.00 figure is breached, traders will immediately see how the pair behaves around the 149.24 area, representing the 61.8% retracement of a previous move from 165.62 to 122.75. Other important downside areas include the 144.19 level. Some technical Support is possible between the 137.60 and 139.15 range.
Price activity is nearest the 200-bar MA (4-hourly) at 185.53 and the 50-bar MA (Hourly) at 167.61.
Technical Support is expected around 147.60/ 144.19/ 136.34 with Stops expected below.
Technical Resistance is expected around 172.88/ 176.60/ 183.33 with Stops expected above.
On 4-Hourly chart, SlowK is Bullishly above SlowD while MACD is Bullishly above MACDAverage.
On 60-minute chart, SlowK is Bullishly above SlowD while MACD is Bullishly above MACDAverage.
Investment Disclaimer