Published
4 years ago on
September 04, 2019
Bitcoin
Bitcoin (BTC/USD) depreciated slightly early in today’s Asian session as the pair receded to the 10522.50 area after trading as high as the 10790.00 area late in yesterday’s European session. Yesterday’s daily high was just below the 10810.13 level that represents the 61.8% retracement of the 8919.72 – 13868.44 range. The pair has been orbiting the 200-bar MA (4-hourly) for the last couple of sessions and chartists are keen to observe whether a constructive base can be established around this area.
One clue emerged yesterday about the pair’s short-term upward bias when Bids emerged above the 10269.89 area, representing the 61.8% retracement of the move from 8045.54 to 13868.44. Traders are also paying close attention to the 10647.72 area, representing the 50% retracement of the 7427.00 – 13868.44 range. Above current market activity, the 10956.99 and 11136.82 are upside price objective targets, and the 11262.06 area is a technically significant area that represents the 38.2% retracement of the move from 13868.44 to 9651.00.
Price activity is nearest the 200-bar MA (4-hourly) at 10,577.13 and the 50-bar MA (Hourly) at 10,239.49.
Technical Support is expected around 9,765.93/ 9,532.39/ 9,265.49 with Stops expected below.
Technical Resistance is expected around 10,810.13/ 11,136.82/ 11,759.72 with Stops expected above.
On 4-Hourly chart, SlowK is Bearishly below SlowD while MACD is Bullishly above MACDAverage.
On 60-minute chart, SlowK is Bearishly below SlowD while MACD is Bearishly below MACDAverage.
Ethereum
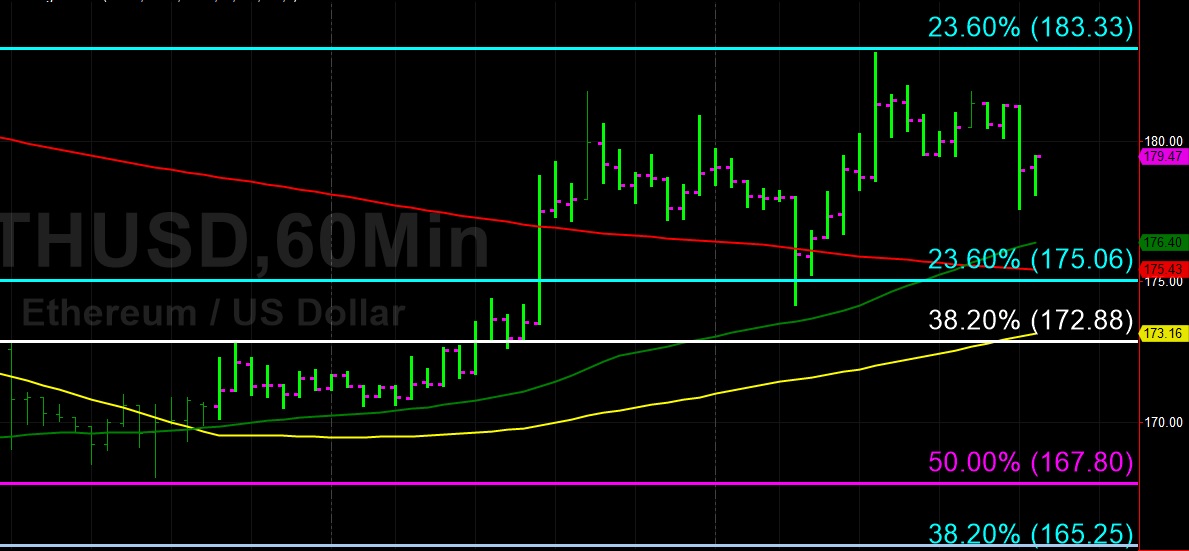
Ethereum (ETH/USD) weakened marginally early in today’s Asian session as the pair traded as low as the 177.62 area following a move to a daily high of 183.15 during yesterday’s European session, just below the 23.6% retracement of the 515.88 – 80.60 range. The 100-bar MA (4-hourly) is also now indicating around the 183.60 area, and these levels are likely to be challenging for ETH/USD in the short-term. The pair is now trading between its 50-bar MA (4-hourly) and its 100-bar MA (4-hourly), an indication that it is searching for short-term direction.
The 50-bar MA (hourly) has crossed above the 200-bar MA (hourly) for the first time since 25 August, and this could result in some ETH/USD strength. Traders continue to note that the pair is trading well below the psychologically-important 200.00 figure, and ETH/USD Bulls are looking to see if the pair can remain above some technical levels including the 175.06 area and the 172.88 area. Above current market activity, traders are observing the 188.38 and 191.40 levels as price objectives. Below current market activity, traders are observing the 167.80 and 165.25 areas as price objectives.
Price activity is nearest the 50-bar MA (4-hourly) at 175.22 and the 50-bar MA (Hourly) at 176.39.
Technical Support is expected around 172.88/ 167.80/ 165.25 with Stops expected below.
Technical Resistance is expected around 183.33/ 188.38/ 191.40 with Stops expected above.
On 4-Hourly chart, SlowK is Bearishly below SlowD while MACD is Bullishly above MACDAverage.
On 60-minute chart, SlowK is Bearishly below SlowD while MACD is Bearishly below MACDAverage.
Investment Disclaimer