Published
4 years ago on
September 05, 2019
Bitcoin
Bitcoin (BTC/USD) edged lower early in today’s Asian session as the pair fell to the 10515.00 area following a move higher to the 10833.14 level late in yesterday’s North American session, just above the a technical level that represents the 61.8% retracement of the move from 8929.91 to 13878.63. Yesterday’s daily high was also the pair’s strongest print since 20 August and opens up the possibility of additional upside price pressure. During a pullback late in yesterday’s European session, the pair came off to the 10380.00 level, just above another technical level that represents the 38.2% retracement of the move from 4702.53 to 13868.44.
BTC/USD has orbited the 200-bar MA (4-hourly) for a few trading sessions, and is now comfortably trading above the 50-bar MA (4-hourly) and 100-bar MA (4-hourly). The pair is at risk of falling below the 50-bar MA (hourly), currently indicating around the 10538.02 area. Another important level that traders are watching is the 10647.72 area, representing the 50% retracement of the 7427.00 – 13868.44 range. Chartists are observing the pair’s price activity around the 10548 area, previously a downside price objective related to the 10 July high of 13202.63.
Price activity is nearest the 200-bar MA (4-hourly) at 10,579.65 and the 50-bar MA (Hourly) at 10,538.02.
Technical Support is expected around 9,765.93/ 9,532.39/ 9,265.49 with Stops expected below.
Technical Resistance is expected around 10,833.14/ 11,136.82/ 11,759.72 with Stops expected above.
On 4-Hourly chart, SlowK is Bearishly below SlowD while MACD is Bullishly above MACDAverage.
On 60-minute chart, SlowK is Bearishly below SlowD while MACD is Bearishly below MACDAverage.
Ethereum
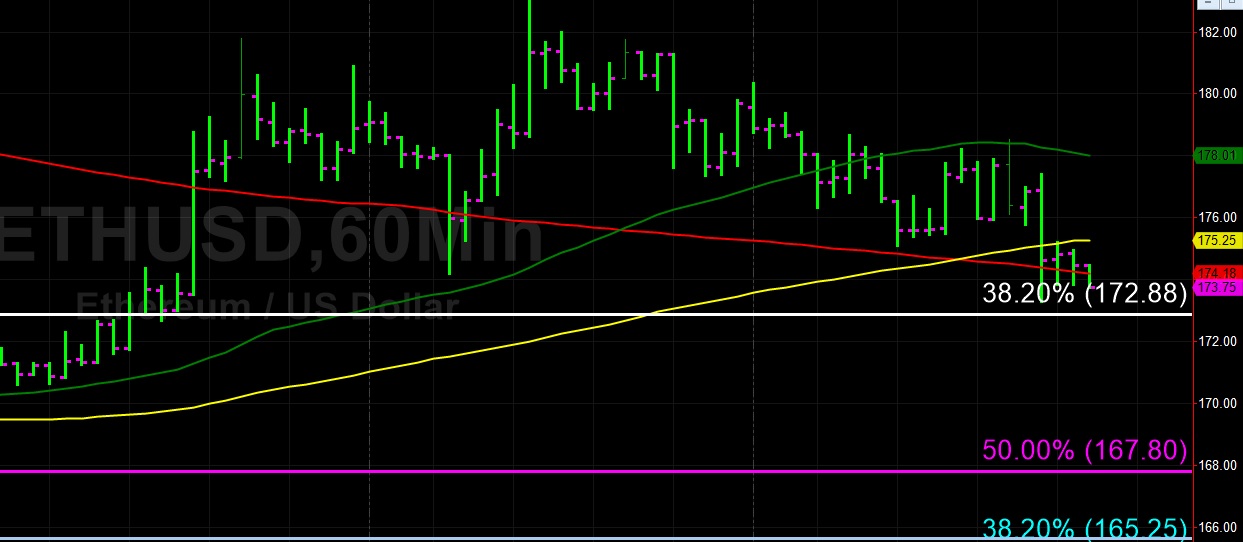
Ethereum (ETH/USD) extended its steady run lower early in today’s Asian session as the pair depreciated to the 173.29 area following its recent peak around the 183.15 area on Tuesday. The pair has again traded below the 50-bar MA (4-hourly), a technical development that is indicative of short-term weakness and a lower bias, and continues to trade between its 50-bar MA (4-hourly) and 100-bar MA (4-hourly). One level that traders are closely watching is the 172.88 area, representing the 38.2% retracement of the move from 322.16 to 80.60.
ETH/USD’s price activity is now trading in a narrow area between the 100-bar MA (hourly) and the 200-bar MA (hourly), and the 50-bar MA (hourly) provided some technical Resistance late in yesterday’s North American session. Given the short-term negative sentiment that is evident, chartists are observing some downside price targets around the 167.80 and 165.25 levels. Below that area, the 157.28 area represents a relative historic low and may be a downside target ahead of the 148 area.
Price activity is nearest the 50-bar MA (4-hourly) at 173.96 and the 200-bar MA (Hourly) at 174.19.
Technical Support is expected around 167.80/ 165.25/ 157.28 with Stops expected below.
Technical Resistance is expected around 183.33/ 188.38/ 191.40 with Stops expected above.
On 4-Hourly chart, SlowK is Bearishly below SlowD while MACD is Bearishly below MACDAverage.
On 60-minute chart, SlowK is Bearishly below SlowD while MACD is Bearishly below MACDAverage.
Investment Disclaimer