Published
4 years ago on
October 12, 2019
Bitcoin
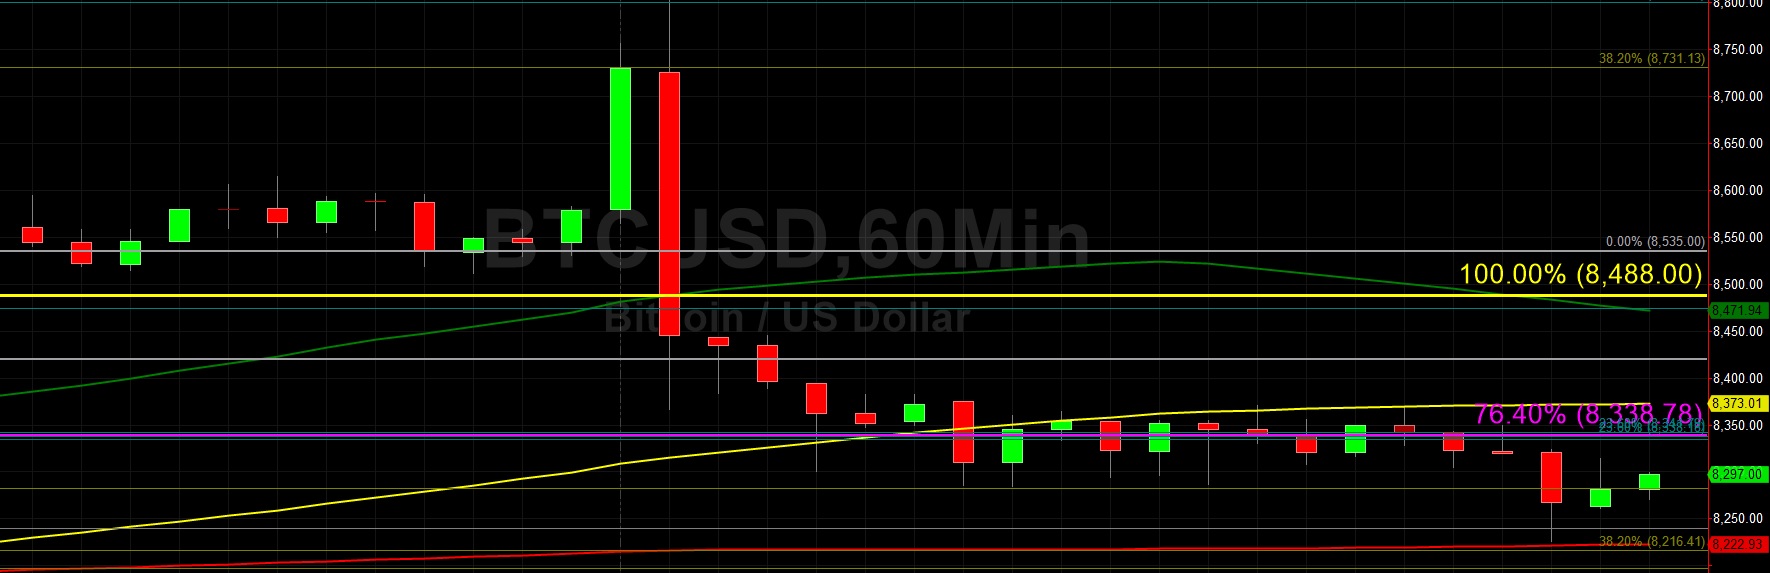
Bitcoin (BTC/USD) was slightly weaker early in today’s Asian session after the pair traded as low as the 8226.00 area late in yesterday’s North American session. Market sentiment improved this week after traders lifted the pair back above the 8000 figure to its strongest level since 24 September following BTC/USD’s acute decline below the psychologically-important 10000 figure. The pair spiked to the 8826.00 level during yesterday’s European session after Stops were elected above the 8692.32 area. One indication of improved sentiment this week emerged when buying pressure kept the pair above the 8473.75 area, representing the 23.6% retracement of the move from 7701.00 to 8712.45. Below this area, areas of potential technical Support include the 8326 and 8206 levels.
Bids could intensify on any pullbacks lower to the 8087 and 7939 levels, but traders will first need to contend with the 50-bar MA (4-hourly) and 100-bar MA (4-hourly). Above current market activity, the 8800.84 area is one that traders are watching, and the 8947.18 area is another area of potential selling pressure. The 9325.90 area represents the 50% retracement of the 10939.34 – 7712.45 range, and the 9706.67 area is the 61.8% retracement of the same range.
Price activity is nearest the 50-bar MA (4-hourly) at 8,231.18 and the 100-bar MA (Hourly) at 8,372.94.
Technical Support is expected around 7,712.45/ 7,508.77/ 7,223.25 with Stops expected below.
Technical Resistance is expected around 9,071.00/ 9,651.00/ 9938.16 with Stops expected above.
On 4-Hourly chart, SlowK is Bearishly below SlowD while MACD is Bearishly below MACDAverage.
On 60-minute chart, SlowK is Bullishly above SlowD while MACD is Bearishly below MACDAverage.
Ethereum
Ethereum (ETH/USD) gained a little bit of ground early in today’s Asian session as the pair traded as high as the 182.89 area after trading as low as the 179.23 area during yesterday’s North American session. Following the pair’s rapid climb back above the 190.00 level this week that saw it print around the 196.09 area, traders are paying very close attention to the 185.71 area, representing the 23.6% retracement of the move from 152.11 to 196.09. During yesterday’s European session, the pair spiked to the 197.93 area, just above the 76.4% retracement of the move from 146.00 to 364.49. Below that area, the 179.29 level represents the 38.2% retracement of the same range. Buying pressure could strengthen at key levels on subsequent pullbacks, especially around the 174 and 168 areas.
Technicians are evaluating market bias by monitoring some additional levels as well, including the way price activity reacts around short-term areas of technical Support, specifically the 190.80 and 188.38 areas. Notably, the 188.38 area is the 61.8% retracement of the move from 255.00 to 80.60 and therefore has significant technical importance. Another important area is the 197.56 area, representing the 76.4% retracement of the move from 146.00 to 364.49. If ETH/USD is able to remain above this area, it has Bullish short-term implications.
Price activity is nearest the 50-bar MA (4-hourly) at 180.51 and the 200-bar MA (Hourly) at 180.28.
Technical Support is expected around 176.40/ 170.95/ 165.01 with Stops expected below.
Technical Resistance is expected around 197.93/ 202.38/ 206.29 with Stops expected above.
On 4-Hourly chart, SlowK is Bearishly below SlowD while MACD is Bearishly below MACDAverage.
On 60-minute chart, SlowK is Bullishly above SlowD while MACD is Bullishly above MACDAverage.
Investment Disclaimer