Published
4 years ago on
October 19, 2019
Bitcoin
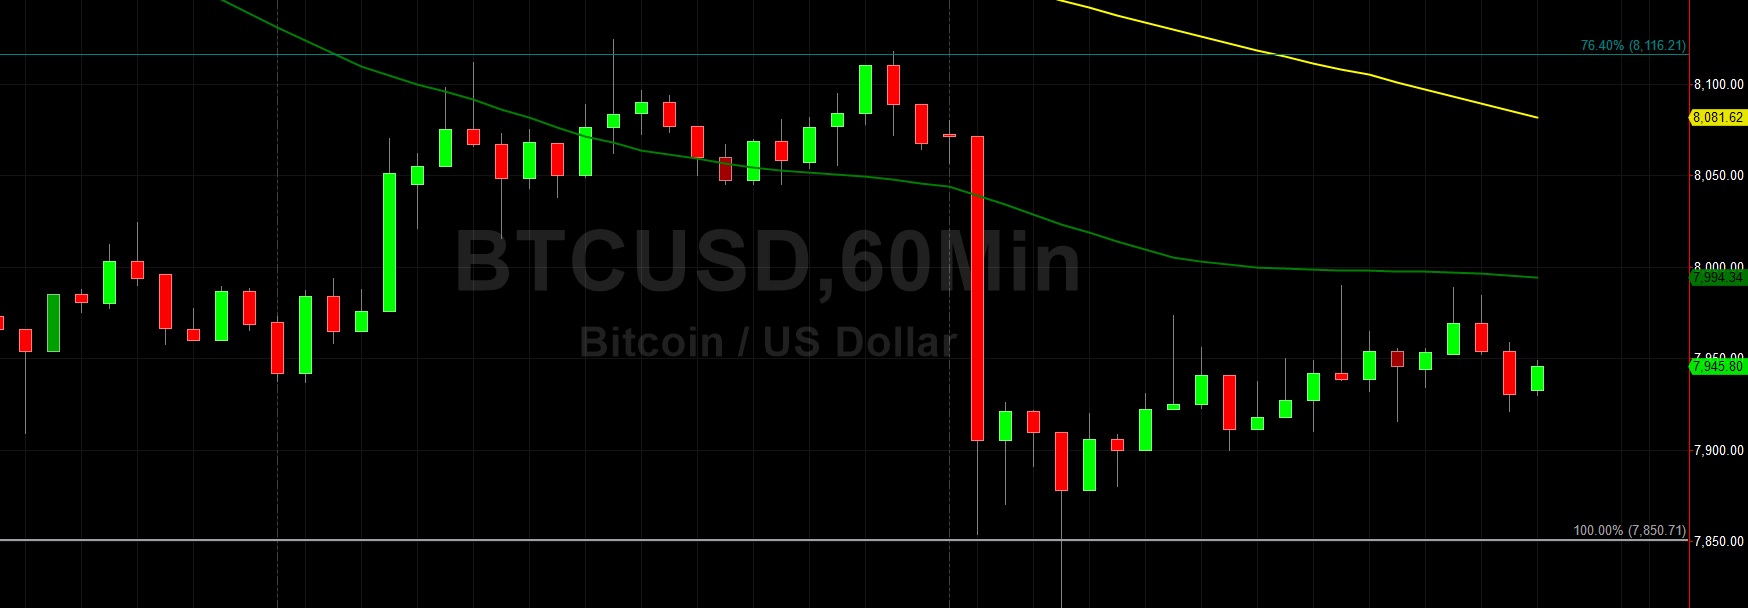
Bitcoin (BTC/USD) drifted lower early in today’s Asian session as traders pushed the pair to the 7921.05 area after the pair traded as high as the 7989.72 area during yesterday’s North American session. Prior to that, the pair tumbled from the 8117.77 level early in yesterday’s Asian session and traded as low as the 7814.08 area before mounting a comeback. The pair continues to orbit the 7966.50 area, representing the 76.4% retracement of the move from 7701.00 – 8826.00.
Weakness in BTC/USD continues to linger as evidenced by its inability to move back above the 50-bar MA (hourly) following its move lower yesterday and early today. Price activity also continues to trade below its 50-bar MA (4-hourly) and 100-bar MA (4-hourly), further evidence of negative market sentiment. Below current market activity, the 7712.45 and 7344.90 areas represent downside price targets. Chartists anticipate some potential buying pressure between the 7147 and 7235 levels. Below those levels, the 6865.68 area and 6540.23 areas represent potential technical Support.
Price activity is nearest the 100-bar MA (4-hourly) at 8,210.34 and the 50-bar MA (Hourly) at 7,994.06.
Technical Support is expected around 7,712.45/ 7,508.77/ 7,223.25 with Stops expected below.
Technical Resistance is expected around 8560.50 /9,071.00/ 9,651.00 with Stops expected above.
On 4-Hourly chart, SlowK is Bullishly above SlowD while MACD is Bullishly above MACDAverage.
On 60-minute chart, SlowK is Bearishly below SlowD while MACD is Bullishly above MACDAverage.
Ethereum
Ethereum (ETH/USD) extended recent losses early in today’s Asian session as the pair came off to the 171.66 area after trading as high as the 175.70 area during yesterday’s North American session. Prior to this, the pair traded as low as the 168.34 area during yesterday’s European session after Stops were elected below the 169.63 area, representing the 61.8% retracement of the move from 152.11 to 197.97. ETH/USD has generally been pressured lower after trading as high as the 179.71 area during Thursday’s European session.
Chartists are observing a convergence of the 50-bar MA (4-hourly) and 100-bar MA (4-hourly) and note that the pair continues to trade below the 50-bar MA (4-hourly), 100-bar MA (4-hourly), and 200-bar MA (4-hourly). Likewise, the pair continues to trade below the 50-bar MA (hourly), 100-bar MA (hourly), and 200-bar MA (hourly). Technicians are looking to see if the pair can remain above the 171.15 area, representing the 61.8% retracement of the move from 168.34 to 175.70. Some buying pressure emerged around the 172.02 area early in today’s Asian session, representing the 50% retracement of the same range.
Price activity is nearest the 100-bar MA (4-hourly) at 179.68 and the 50-bar MA (Hourly) at 174.56.
Technical Support is expected around 168.34/ 165.25/ 162.93 with Stops expected below.
Technical Resistance is expected around 170.08 /179.84/ 183.33 with Stops expected above.
On 4-Hourly chart, SlowK is Bullishly above SlowD while MACD is Bearishly below MACDAverage.
On 60-minute chart, SlowK is Bearishly below SlowD while MACD is Bullishly above MACDAverage.
Investment Disclaimer