Published
4 years ago on
October 21, 2019
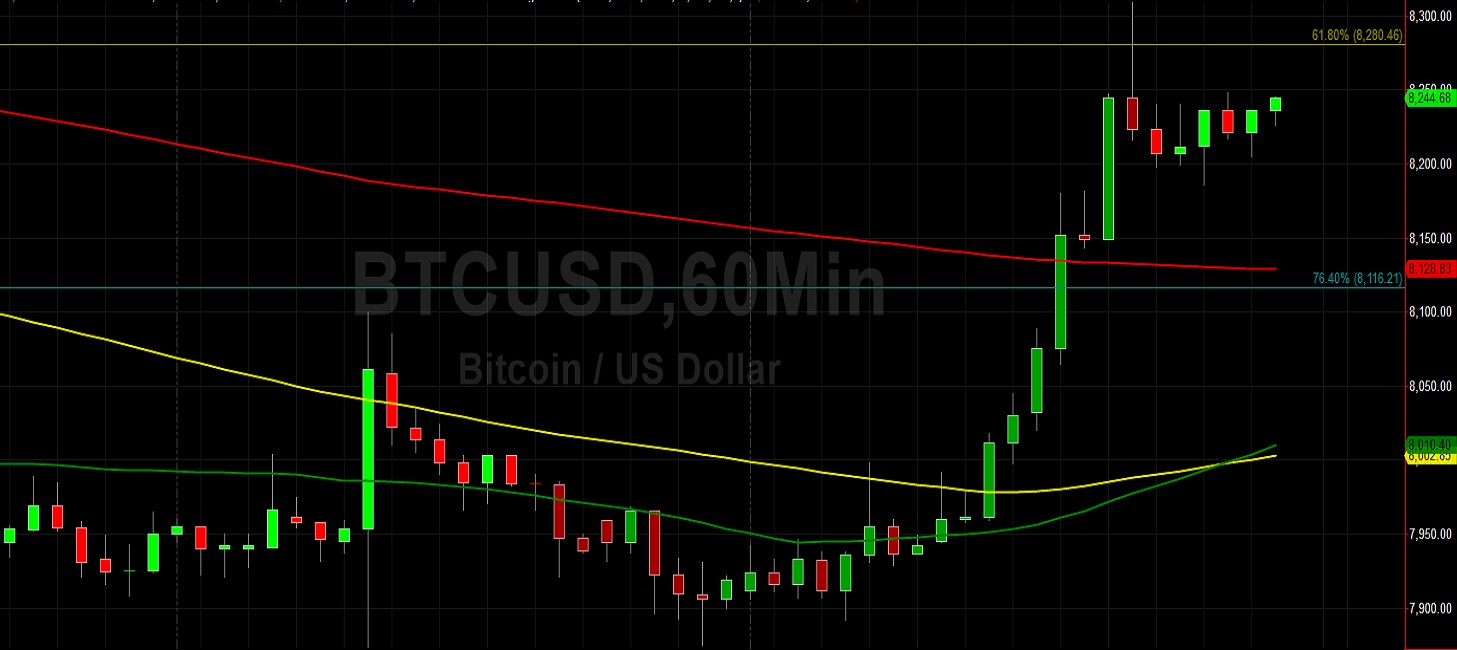
Bitcoin (BTC/USD) was slightly weaker early in today’s Asian session after the pair rocketed higher during yesterday’s North American session, trading as high as the 8309.00 area. Stops were elected above the 8263.50 area during the pair’s move higher, representing the 50% retracement of the move from 7701.00 to 8826.00. After the pair reached that level, profit-taking ensued and Bids emerged right around the 100-bar MA (4-hourly), an indication that traders may soon focus on this indicator as technical Support and technical Resistance.
If BTC/USD is able to extend its recent upward trajectory, traders will focus on some key levels. The 200-bar MA (4-hourly) is currently indicating around the 8567.07 area, and it appears to be headed for a convergence with the 100-bar MA (4-hourly). Traders anticipate some selling pressure between the 8330 and 8353 levels. Also, the 8502 area represents the 50% retracement of the 3186.25 – 13868.44 range. Below current market activity, traders are looking to see how price activity reacts around the 8192 and 8119 areas. Chartists are noting the 50-bar MA (hourly) just crossed above the 100-bar MA (hourly), a bullish development.
Price activity is nearest the 100-bar MA (4-hourly) at 8,187.19 and the 200-bar MA (Hourly) at 8,129.13.
Technical Support is expected around 7,712.45/ 7,508.77/ 7,223.25 with Stops expected below.
Technical Resistance is expected around 8560.50 /9,071.00/ 9,651.00 with Stops expected above.
On 4-Hourly chart, SlowK is Bullishly above SlowD while MACD is Bullishly above MACDAverage.
On 60-minute chart, SlowK is Bullishly above SlowD while MACD is Bullishly above MACDAverage.
Ethereum (ETH/USD) slumped early in today’s Asian session as the pair receded to the 174.16 level after capping out around the 176.80 level late in yesterday’s North American session, a level that is just below the 76.4% retracement of the recent 179.71 – 168.34 range. The pair is orbiting the 175.04 area and it is an important level because it represents the 50% retracement of the 152.11 – 197.97 range. Another important level related to that range is the 169.63 area, representing its 61.8% retracement.
If the pair’s recent upward trajectory continues, traders are curious to see how price activity will react around the 50-bar MA (4-hourly), currently indicating around the 177.50 area, with the 100-bar MA (4-hourly) above it and indicating around the 179.34 area. Likewise, the 200-bar MA (4-hourly) is above those areas and currently indicating around the 183.75 area. One additional upside level that traders are monitoring is the 178.46 area, representing the 50% retracement of the 188.58 – 168.34 range.
Price activity is nearest the 50-bar MA (4-hourly) at 177.50 and the 100-bar MA (Hourly) at 173.74.
Technical Support is expected around 167.80/ 165.25/ 162.93 with Stops expected below.
Technical Resistance is expected around 180.45/ 183.33/ 187.15 with Stops expected above.
On 4-Hourly chart, SlowK is Bullishly above SlowD while MACD is Bullishly above MACDAverage.
On 60-minute chart, SlowK is Bearishly below SlowD while MACD is Bullishly above MACDAverage.
Investment Disclaimer