Bitcoin
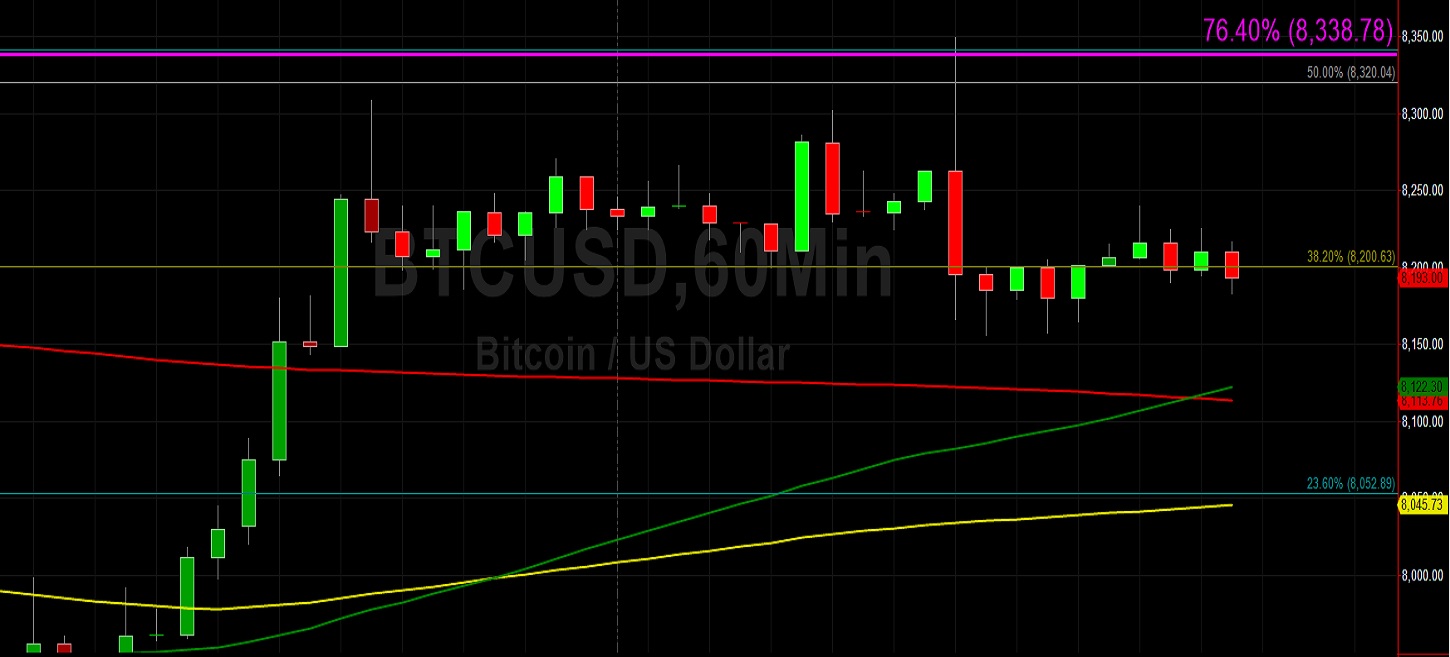
Bitcoin (BTC/USD) traded mostly sideways early in today’s Asian session as the pair moved to the 8195.11 level after spiking to the 8349.84 area during yesterday’s North American session. Some minor Stops were elected above the 8338.78 level during yesterday’s rapid climb, representing the 76.4% retracement of the 9948.12 – 3128.89 range. The pair twice tested the 8280.46 area during yesterday’s Asian session and yesterday’s North American session, a level that represents the 61.8% retracement of the move from 7850.71 – 8975.71 range. Chartists are noting that the 50-bar MA (hourly) crossed above the 100-bar MA (hourly) and 200-bar MA (hourly), a bullish development.
Traders are also observing price activity around the 8200.63 level, an area where technical Support has emerged a few times over the past few trading sessions and that also represents the 38.2% retracement of the 8826.00 – 7814.08 range. One of the pair’s biggest challenges on the upside will likely be the 8341.89 level, representing the 23.6% retracement of the 10379.15 – 7712.45 range. Likewise, the 8474.00 area represents the 23.6% retracement of the 10939.34 – 7712.45 range.
Price activity is nearest the 100-bar MA (4-hourly) at 8,190.97 and the 50-bar MA (Hourly) at 8,122.28.
Technical Support is expected around 7,712.45/ 7,508.77/ 7,223.25 with Stops expected below.
Technical Resistance is expected around 8560.50 /9,071.00/ 9,651.00 with Stops expected above.
On 4-Hourly chart, SlowK is Bearishly below SlowD while MACD is Bullishly above MACDAverage.
On 60-minute chart, SlowK is Bearishly below SlowD while MACD is Bearishly below MACDAverage.
Ethereum
Ethereum (ETH/USD) was a little weaker early in today’s Asian session as the pair moved to the 173.65 area after earlier trading as low as the 171.45 area during yesterday’s North American session following a spike higher to the 178.00 figure. Bids emerged just above the 171.21 level during the pullback lower, representing the 76.4% retracement of the move from 169.11 to 178.00. The pair challenged the 50-bar MA (4-hourly) during yesterday’s North Amercian session and upward momentum could see the pair test the 100-bar MA (4-hourly). Prior to testing the 100-bar MA (4-hourly), however, the pair will need to challenge the 178.46 area, a level that represents the 50% retracement of the 188.58 – 168.34 range. Additional important levels in that range include the 180.85 and 183.80 areas.
ETH/USD Bulls may need to first contend with some stronger technical Resistance around the 179.84 area, representing the 38.2% retracement of the 224.71 – 152.11 range. The next upside level related to that range is the 188.41 area, its 50% retracement, and chartists are certain of the range’s significance given the manner the pair bounced higher off the 169.24 area on 6 October and 18 October. Traders are also looking to see how the pair reacts around the 173.12 level during any pullback.
Price activity is nearest the 50-bar MA (4-hourly) at 176.54 and the 50-bar MA (Hourly) at 173.57.
Technical Support is expected around 167.80/ 165.25/ 162.93 with Stops expected below.
Technical Resistance is expected around 180.45/ 183.33/ 187.15 with Stops expected above.
On 4-Hourly chart, SlowK is Bullishly above SlowD while MACD is Bullishly above MACDAverage.
On 60-minute chart, SlowK is Bearishly below SlowD while MACD is Bearishly below MACDAverage.
Investment Disclaimer


