Published
4 years ago on
October 03, 2019
Bitcoin
Bitcoin (BTC/USD) continued to follow some technical trading patterns early in today’s Asian session as the pair glided higher to the 8419.95 area. During yesterday’s European session, Bids emerged around the 8216.41 area, representing the 38.2% retracement of the 7701.00 – 8535.00 range, and the pair orbited the 50-bar MA (4-hourly). Earlier in yesterday’s European session, buying activity also emerged around the 100-bar MA (hourly), then indicating around the 8175 area. Trading activity has recently been seen between the 100-bar MA (hourly) and 50-bar MA (hourly), and chartists are observing a Bullish convergence of the 50-bar MA (hourly) and the 200-bar MA (hourly).
Traders are also paying close attention to another range, namely the recent depreciation from 8995.00 to 7712.45. The importance of this range was reconfirmed during yesterday’s European session when Bids emerged around the 8202.38 area, representing the 38.2% retracement of this range. Additional Bids related to this range include the 8015.43 area, representing the 23.6% retracement of this range. Above current price activity area, chartists are observing some upside price objectives around the 9391, 9430, 9470, and 9532 levels. Below current market activity, technical Support is likely around the 7508/ 7344/ 7235 levels. Additional buying demand is likely between the 7084 and 7147 levels.
Price activity is nearest the 50-bar MA (4-hourly) at 8,214.28 and the 50-bar MA (Hourly) at 8,311.96.
Technical Support is expected around 7,712.45/ 7,508.77/ 7,223.25 with Stops expected below.
Technical Resistance is expected around 9,071.00/ 9,651.00/ 10,097.80 with Stops expected above.
On 4-Hourly chart, SlowK is Bearishly below SlowD while MACD is Bullishly above MACDAverage.
On 60-minute chart, SlowK is Bullishly above SlowD while MACD is Bullishly above MACDAverage.
Ethereum
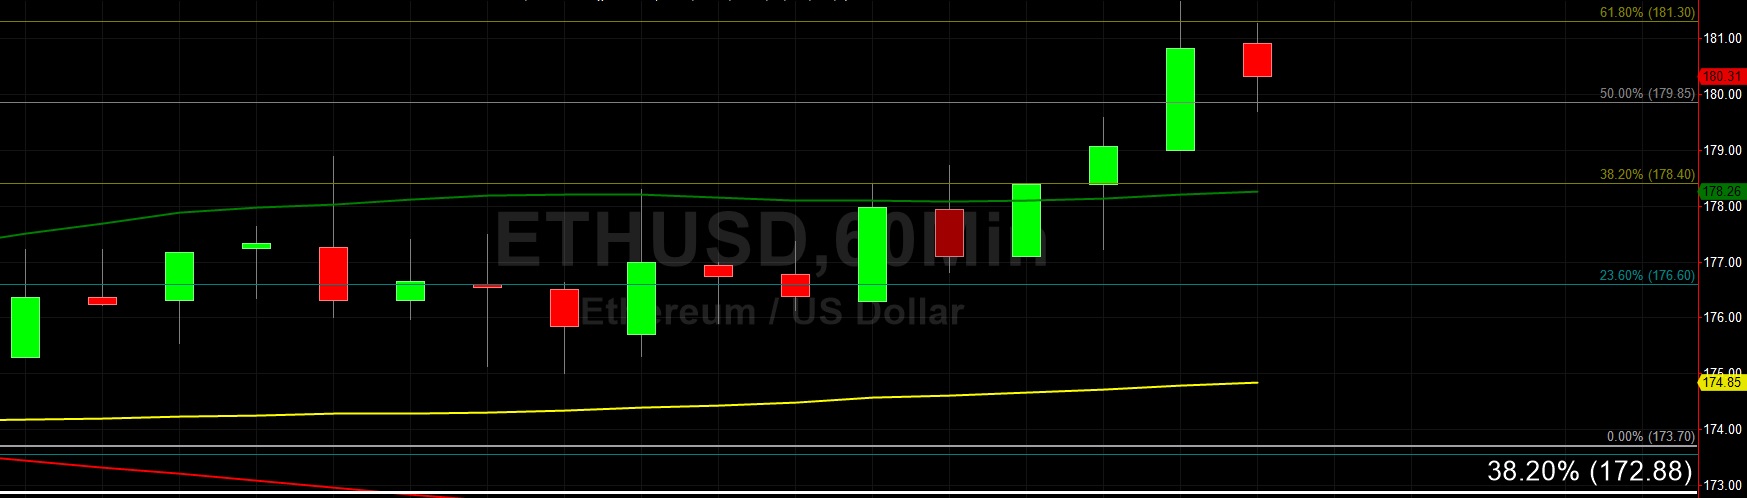
Ethereum (ETH/USD) traded as high as the 181.26 level early in today’s Asian session as the pair continued to test upside price objectives related to the recent depreciation from 185.89 to 173.85. Stops were elected above the 176.69 area during yesterday’s European session, representing the 23.6% retracement of the aforementioned range, and were later triggered above the 178.45 area, representing the 38.2% retracement of the same range. Price activity continues to make progress above the 50-bar MA (4-hourly), and yesterday moved above the 50-bar MA (hourly), then indicating around the 178.07 area.
Chartists have also observed a bullish crossover of the 100-bar MA (hourly) above the 200-bar MA (hourly) and also note the 50-bar MA (hourly) also Bullishly crossed above the 200-bar MA (hourly). These technical developments suggest a Bullish short-term market bias for ETH/USD. Additional areas that traders are monitoring include the 183.33 and 191.23 areas as part of the recent depreciation from 224.71 to 157.75. The 199.13 area also represents the 61.8% retracement of this range. Below current market activity, traders are looking to see if ETH/USD can remain above the 172.99, 169.00, 165.01, and 160.08 levels.
Price activity is nearest the 200-bar MA (4-hourly) at 183.69 and the 50-bar MA (Hourly) at 178.25.
Technical Support is expected around 167.80/ 155.50/ 147.60 with Stops expected below.
Technical Resistance is expected around 188.38/ 191.40/ 201.38 with Stops expected above.
On 4-Hourly chart, SlowK is Bullishly above SlowD while MACD is Bullishly above MACDAverage.
On 60-minute chart, SlowK is Bullishly above SlowD while MACD is Bullishly above MACDAverage.
Investment Disclaimer