
Published
4 years ago on
October 31, 2019
Bitcoin
Bitcoin (BTC/USD) pared minor gains early in today’s Asian session as the pair fell back to the 9145.00 area after trading as high as the 9236.76 area late in yesterday’s North American session. Bids emerged around the 8991.33 area during yesterday’s European session, just below the 76.4% retracement of the 7508.77 – 13868.44 range. Short-term market sentiment began to erode late in yesterday’s Asian session when the pair peaked around the 9515.03 area, unable to move above the 9532.39 area that represents the 38.2% retracement of the 19891.99 – 3128.89 area.
Chartists are closely watching the 8918.47 area as the pair’s next potential area of technical Support, as it represents the 50% retracement of the 7296.44 – 10540.49 range. Below that area, the 8688.03 area represents the 38.2% retracement of the move from 10939.34 to 7296.44. The 50-bar MA (4-hourly) is also trading around this area, and could provide some buying pressure. Traders are also monitoring the recent crossover of the 100-bar MA (hourly) above the 50-bar MA (hourly), an indication of potential short-term weakness.
Price activity is nearest the 50-bar MA (4-hourly) at 8,728.75 and the 50-bar MA (Hourly) at 9,281.30.
Technical Support is expected around 8918.47/ 8535.67/ 8062.04 with Stops expected below.
Technical Resistance is expected around 9774.89/ 10540.49/ 10939.34 with Stops expected above.
On 4-Hourly chart, SlowK is Bullishly above SlowD while MACD is Bearishly below MACDAverage.
On 60-minute chart, SlowK is Bullishly above SlowD while MACD is Bullishly above MACDAverage.
Ethereum
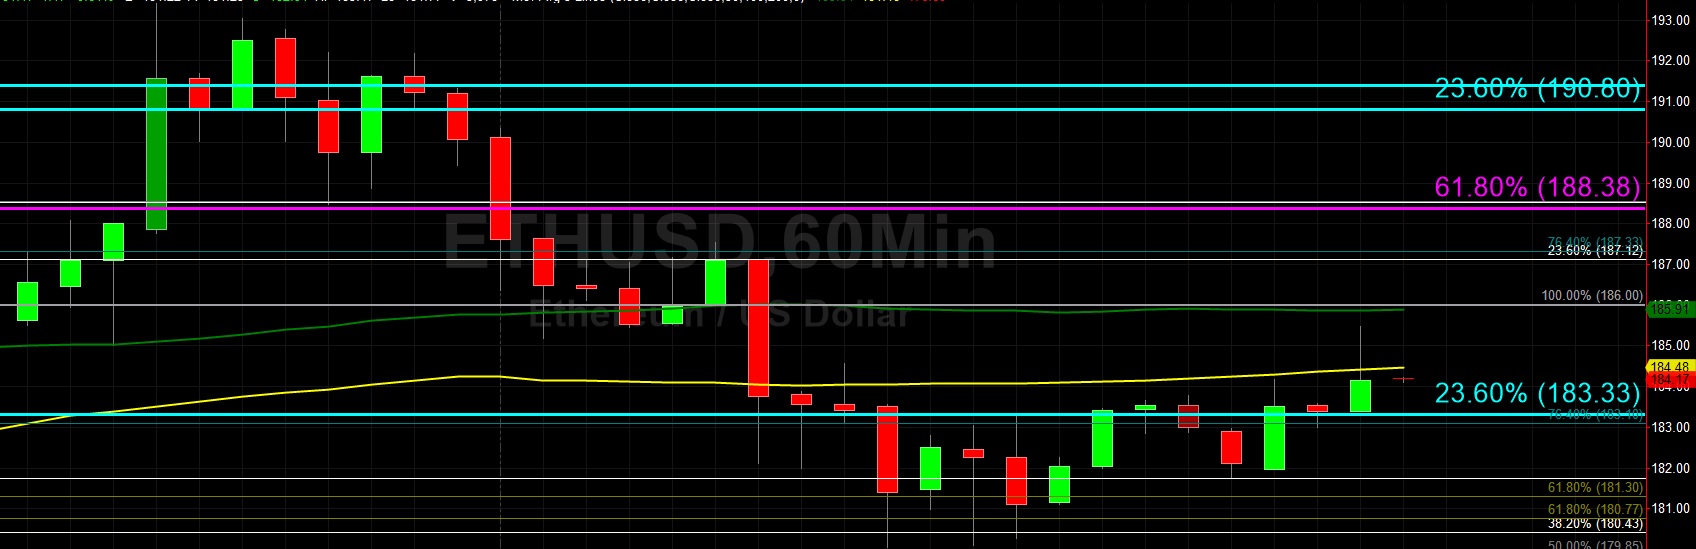
Ethereum (ETH/USD) appreciated early in today’s Asian session as the pair escalated to the 185.47 area after trading as low as the 180.05 area during yesterday’s North American session. Downward price pressure emerged during yesterday’s Asian session when the pair crested around the 193.45 area, representing the 76.4% retracement of the 199.50 – 173.86 range. Price activity steadily eroded throughout the European session as traders eventually tested the 182.00 area, right around the 76.4% retracement of the 148.91 – 288.87 range. Traders are alert for technical Support between the 179.91 and 180.45 areas.
Chartists are noting that the 50-bar MA (4-hourly), 100-bar MA (4-hourly), and 200-bar MA (4-hourly) have converged, an indication that traders are attempting to determine market sentiment. If the short-term market bias continues to deteriorate, traders anticipate some buying pressure between the 172.72 and 175.04 areas, with additional Bids expected below those levels around the 169.63 area. Another key level traders are watching is the 165.25 area, representing the 38.2% retracement of the 302.20 – 80.60 range, below which Stops are likely in place.
Price activity is nearest the 200-bar MA (4-hourly) at 177.07 and the 50-bar MA (Hourly) at 185.50.
Technical Support is expected around 180.05/ 175.04/ 169.63 with Stops expected below.
Technical Resistance is expected around 193.41/ 199.50/ 202.38 with Stops expected above.
On 4-Hourly chart, SlowK is Bullishly above SlowD while MACD is Bearishly below MACDAverage.
On 60-minute chart, SlowK is Bullishly above SlowD while MACD is Bullishly above MACDAverage.
Investment Disclaimer


