Published
4 years ago on
October 05, 2019
Bitcoin
Bitcoin (BTC/USD) depreciated to the 8110.04 level early in today’s Asian session as the pair continued to edge closer to the psychologically-important 8000 figure. The pair appears to have developed a downward bias following its moves around some technical levels including the 8338.18 area, a level BTC/USD was unable to test during yesterday’s Asian session. Likewise, the 8321.36 level represents the 76.4% retracement of the move from 8419.95 to 8002.21. Given the near-term negative sentiment, chartists are looking to see if the pair will test technical Support around the 7897.82 area ahead of buying pressure that has emerged around the 7701.00 area a couple of times.
The 50-bar MA (hourly), 100-bar MA (hourly), and 200-bar MA (hourly) have all converged and this technical development is indicative of a lack of definitive market sentiment. The pair continues to orbit the 50-bar MA (4-hourly), another indication that a clear-cut market bias remains elusive. If the downward trend resumes, traders will pay close attention to levels including the 7344.90 area, representing the 61.8% retracement of the move from 9949.85 to 3130.62. Another important level related to that range is the 6540.23 area, representing its 50% retracement. Some buying demand is expected between the 7084 – 7147 areas.
Price activity is nearest the 50-bar MA (4-hourly) at 8,174.30 and the 200-bar MA (Hourly) at 8,167.09.
Technical Support is expected around 7,712.45/ 7,508.77/ 7,223.25 with Stops expected below.
Technical Resistance is expected around 8,488.00/ 9,071.00/ 9,651.00 with Stops expected above.
On 4-Hourly chart, SlowK is Bearishly below SlowD while MACD is Bearishly below MACDAverage.
On 60-minute chart, SlowK is Bearishly below SlowD while MACD is Bearishly below MACDAverage.
Ethereum
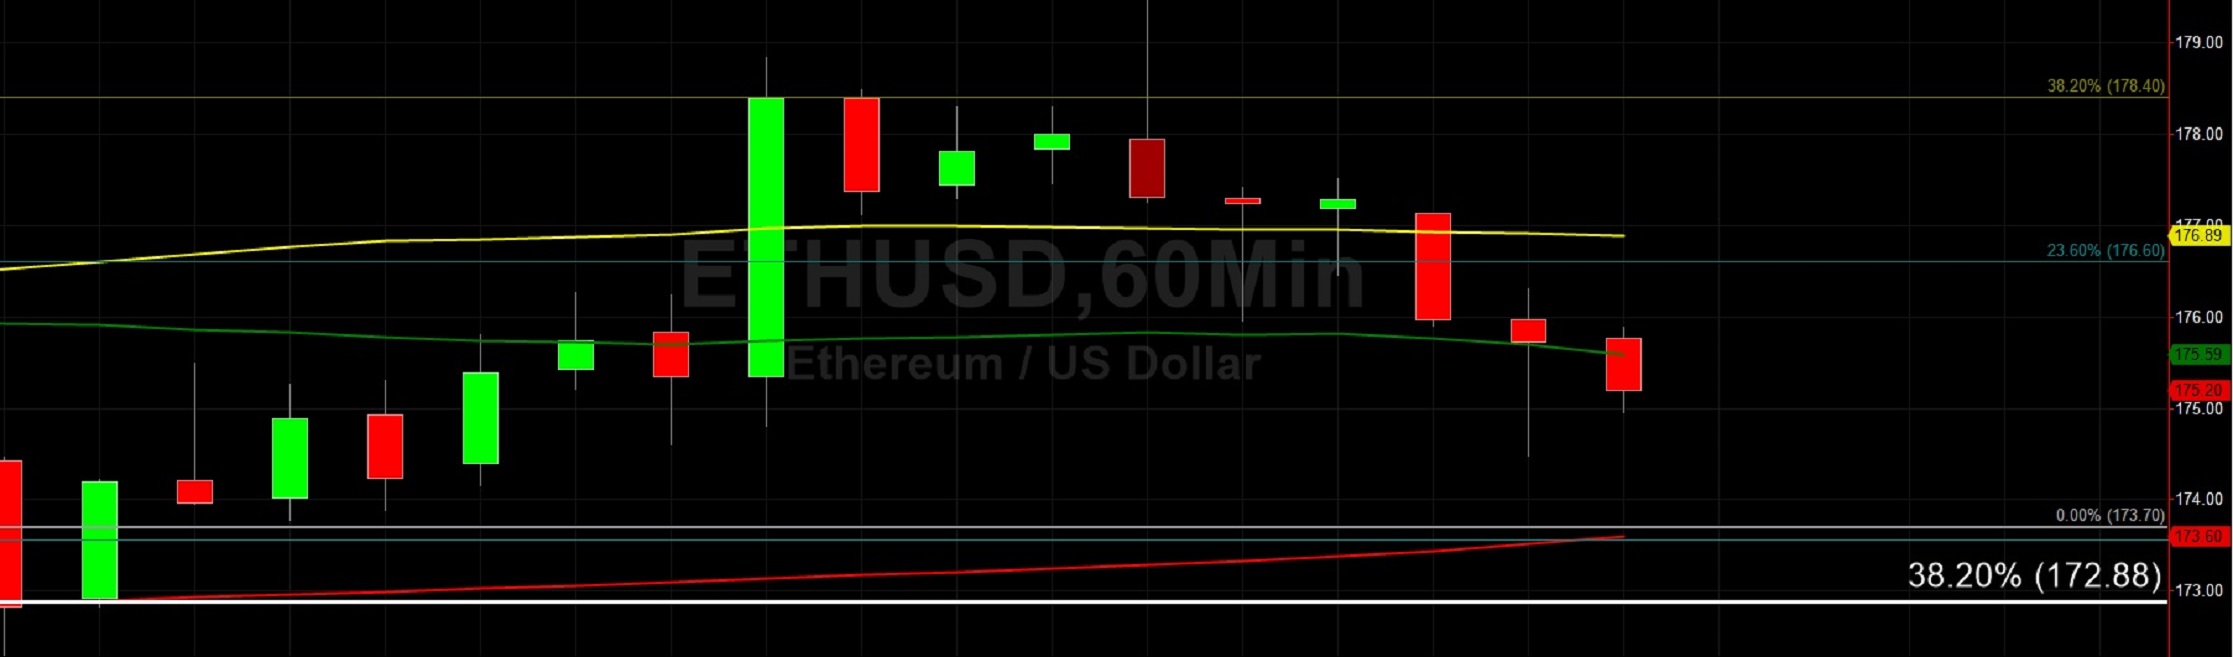
Ethereum (ETH/USD) depreciated early in today’s Asian session as the pair tested the 174.48 level after peaking around the 179.69 level during yesterday’s North American session. Some clues have emerged about the pair’s likely short-term bias including trading activity below the 177.92 area, representing the 23.6% retracement of the 152.11 – 185.89 range. ETH/USD tested the 179.66 area but not the 182.04 level, retracement levels related to the 185.89 – 169.59 range. The pair continues to orbit the 50-bar MA (4-hourly) and its 200-bar MA (hourly).
The 50-bar MA (hourly) and 100-bar MA (hourly) recently converged around the 176 area and this indicates that traders lack a defined market bias. If downward trading pressure resumes, the 167.80 area will be closely monitored by traders as it represents the 50% retracement of the 255.00 – 80.60 range. Its technical significance was reconfirmed on 24 September when ETH/USD Bears shattered the psychologically-important 200.00 figure. Below that area, the 165.25 and 155.50 areas are also important levels that technicians are observing.
Price activity is nearest the 50-bar MA (4-hourly) at 173.86 and the 50-bar MA (Hourly) at 175.59.
Technical Support is expected around 167.80/ 155.50/ 147.60 with Stops expected below.
Technical Resistance is expected around 188.38/ 191.40/ 201.38 with Stops expected above.
On 4-Hourly chart, SlowK is Bullishly above SlowD while MACD is Bearishly below MACDAverage.
On 60-minute chart, SlowK is Bearishly below SlowD while MACD is Bearishly below MACDAverage.
Investment Disclaimer