Published
4 years ago on
October 06, 2019
Bitcoin
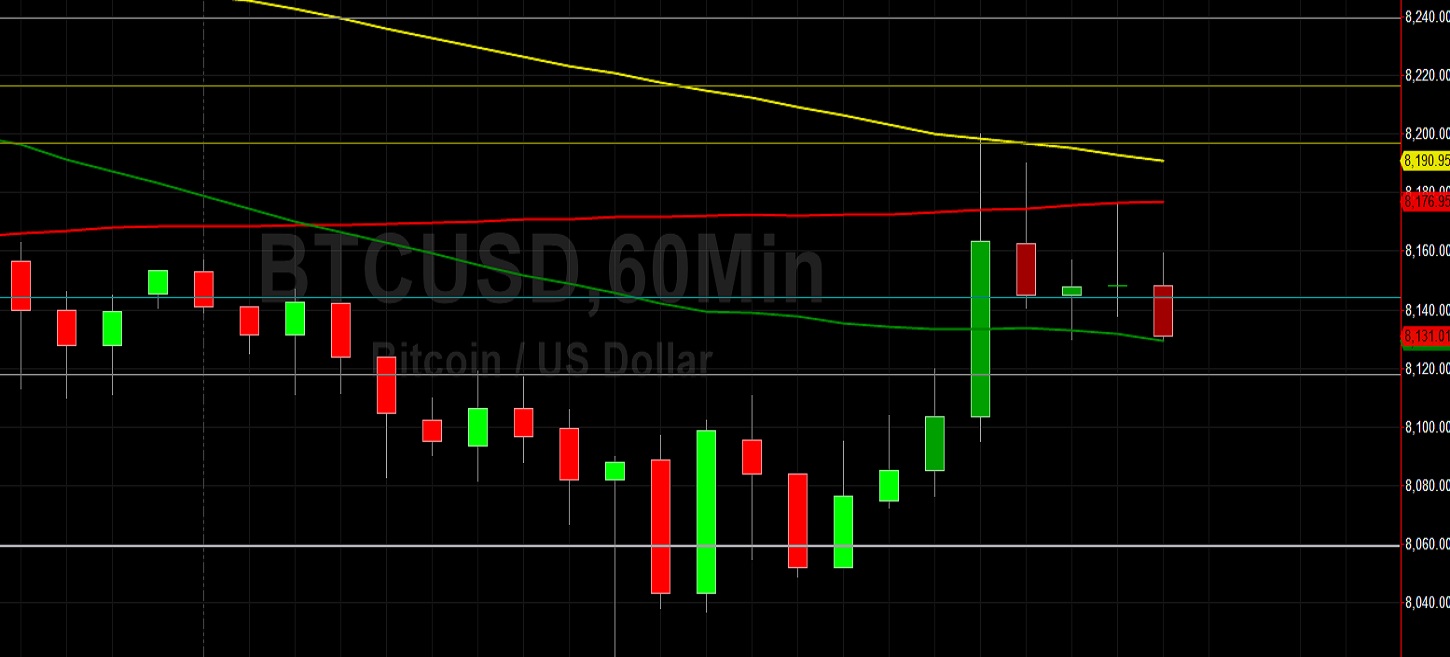
Bitcoin (BTC/USD) appreciated to the 8176.18 level early in today’s Asian session as the pair tested its 50-bar MA (4-hourly) and them came off. Bids emerged around the 8020.20 area during yesterday’s European session after negative market sentiment saw the pair glide lower during Friday’s European session and test the 8002.21 level after some Stops were elected below the 8019.59 area, a level that represents the 61.8% retracement of the 7701.00 – 8535.00 range. Traders have been unable to retest the 8260.37 area following the move lower, and this level is significant because it represents the 61.8% retracement of the 8419.95 – 8002.21 range.
BTC/USD continues to orbit the 50-bar MA (4-hourly) and the 50-bar MA (hourly), 100-bar MA (hourly), and 200-bar MA (hourly) appear to be converging, evidencing the fact that traders are looking for a market bias. Notably, the pair has been unable to wander too far above the 8202.38 level, representing the 38.2% retracement of the 8995.00 – 7712.45 range, the pair’s general range following its move below the psychologically-important 10000 figure a couple of weeks ago. Below current market activity, traders are looking to see if the pair can remain above the 8015.13 level, representing the 23.6% retracement of the aforementioned range. Additional important areas include the 7897.82, 7344.90, and 6540.23 areas.
Price activity is nearest the 50-bar MA (4-hourly) at 8,186.84 and the 50-bar MA (Hourly) at 8,129.90.
Technical Support is expected around 7,712.45/ 7,508.77/ 7,223.25 with Stops expected below.
Technical Resistance is expected around 8,488.00/ 9,071.00/ 9,651.00 with Stops expected above.
On 4-Hourly chart, SlowK is Bullishly above SlowD while MACD is Bearishly below MACDAverage.
On 60-minute chart, SlowK is Bearishly below SlowD while MACD is Bullishly above MACDAverage.
Ethereum
Ethereum (ETH/USD) appreciated to the 177.12 level early in today’s Asian session as the pair attempted to establish a fresh multi-session high. The pair continues to trade very technically within a couple of important ranges. Offers emerged during Friday’s North American session when the pair approached ther 179.66 area, representing the 61.8% retracement of the move from 185.89 to 169.59. Notably, that level is also right around the 38.2% retracement of the move from 224.71 to 152.11. Recent trading activity has also bottomed out around the 169.24 area, representing the 23.6% retracement of the same range.
ETH/USD continues to trade around its 50-bar MA (4-hourly) and 50-bar MA (hourly), an indication the markets lack a directional bias. The pair has recently traded between its 100-bar MA (hourly) and 200-bar MA (hourly), another indication that sentiment remains clouded. Below current market activity, chartists are observing the 167.80 area as a level of potential technical Support, with Bids likely stronger around the 165.25 area. Above current market activity, technicians are eyeing the 187.41 level as an area of potential technical Resistance.
Price activity is nearest the 50-bar MA (4-hourly) at 175.09 and the 100-bar MA (Hourly) at 175.84.
Technical Support is expected around 167.80/ 155.50/ 147.60 with Stops expected below.
Technical Resistance is expected around 188.38/ 191.40/ 201.38 with Stops expected above.
On 4-Hourly chart, SlowK is Bullishly above SlowD while MACD is Bullishly above MACDAverage.
On 60-minute chart, SlowK is Bullishly above SlowD while MACD is Bullishly above MACDAverage.
Investment Disclaimer