Published
4 years ago on
October 07, 2019
Bitcoin
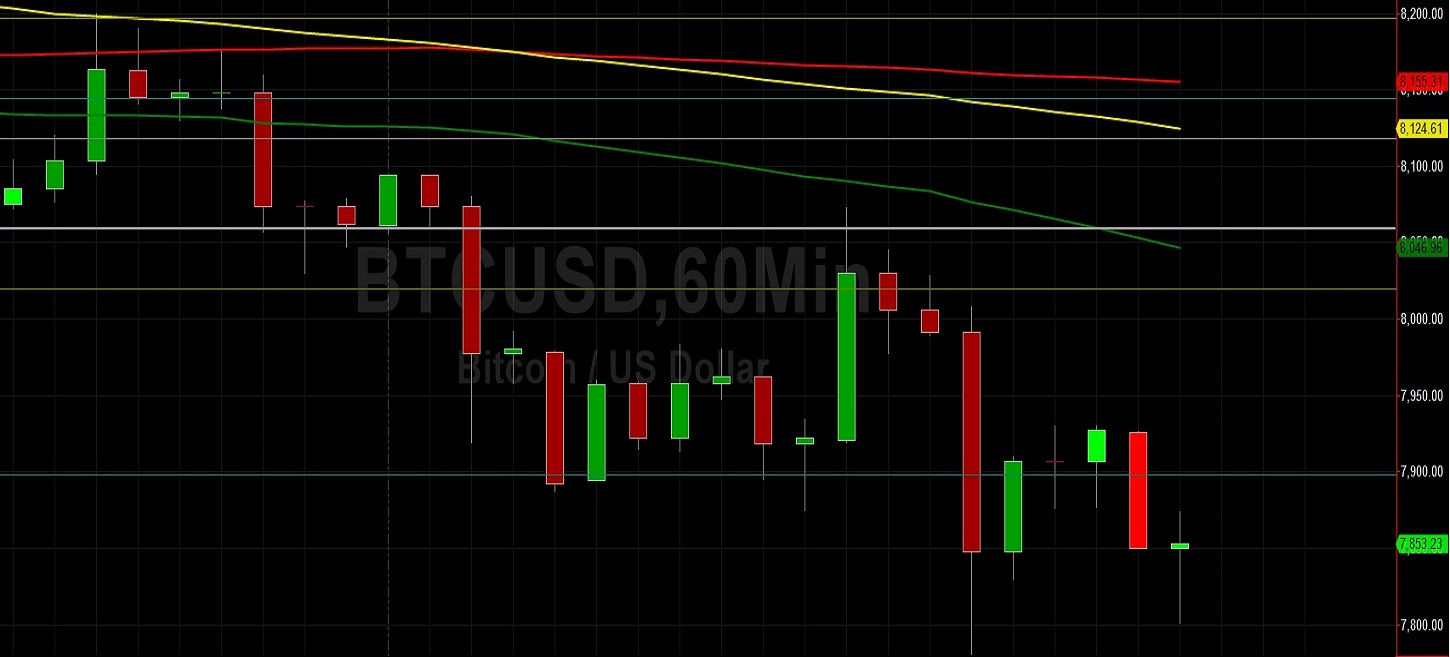
Bitcoin (BTC/USD) extended some recent weakness early in today’s Asian session as the pair traded as low as the 7801.00 level following weakness during yesterday’s North American session. Trading conviction remains muted as market sentiment is showing neither a Bullish bias nor a Bearish bias in the medium-term, and this is keeping the pair confined to a relatively narrow range above the 8000 figure. If the pair is going to make an upside charge, it must derive enough momentum to absorb selling pressure around the 8211.08 area, representing the 50% retracement of the move from 8419.95 to 8002.21.
Above that area, the 8260.37 area and the 8321.36 area also represent upside technical challenges, and the 8340.51 level represents the 76.4% retracement of the 9949.85 – 3130.62 range. Chartists also anticipate some technical Resistance around the 8432 – 8474 range with stronger Offers around the 8502.35 level. Also, the 8692.32 area represents the 76.4% retracement of the 8995.00 – 7712.45 range, and the 100-bar MA (4-hourly) is currently indicating just above this area. These upside headwinds could result in a downward bias and negative technical sentiment for the pair.
Price activity is nearest the 50-bar MA (4-hourly) at 8,163.07 and the 50-bar MA (Hourly) at 8,047.05.
Technical Support is expected around 7,712.45/ 7,508.77/ 7,223.25 with Stops expected below.
Technical Resistance is expected around 8,488.00/ 9,071.00/ 9,651.00 with Stops expected above.
On 4-Hourly chart, SlowK is Bearishly below SlowD while MACD is Bearishly below MACDAverage.
On 60-minute chart, SlowK is Bearishly below SlowD while MACD is Bearishly below MACDAverage.
Ethereum
Ethereum (ETH/USD) found some buying pressure early in today’s Asian session as the pair recovered from the 167.50 level it reached during yesterday’s North American session. Traders continue to keep the pair within a relatively narrow range and continue to indecisively test technical levels related to the 185.89 – 169.59 range. If ETH/USD is going to make a run higher, it must challenge and absorb the 179.66 area, representing the 61.8% retracement of the aforementioned range, and then test the 182.04 area, representing the 76.4% retracement of the same range.
Notably, the 100-bar MA (4-hourly) and 200-bar MA (4-hourly) are indicating just above these levels, and they may also keep ETH/USD pressured. If these levels are able to be absorbed, the 185.89 and 187.41 areas will come in to view as areas of potential technical Resistance. Additionally, the 191.40 area represents the 50% retracement of the 302.20 – 80.60 range and the 190.76 area represents the 23.6% retracement of the 547.40 – 80.60 range. Selling pressure is anticipated between the 196.10 and 197.56 areas.
Price activity is nearest the 50-bar MA (4-hourly) at 174.94 and the 50-bar MA (Hourly) at 174.27.
Technical Support is expected around 165.01/ 155.50/ 147.60 with Stops expected below.
Technical Resistance is expected around 177.92/ 181.95/ 188.38 with Stops expected above.
On 4-Hourly chart, SlowK is Bearishly below SlowD while MACD is Bearishly below MACDAverage.
On 60-minute chart, SlowK is Bearishly below SlowD while MACD is Bearishly below MACDAverage.
Investment Disclaimer