Published
4 years ago on
November 27, 2019
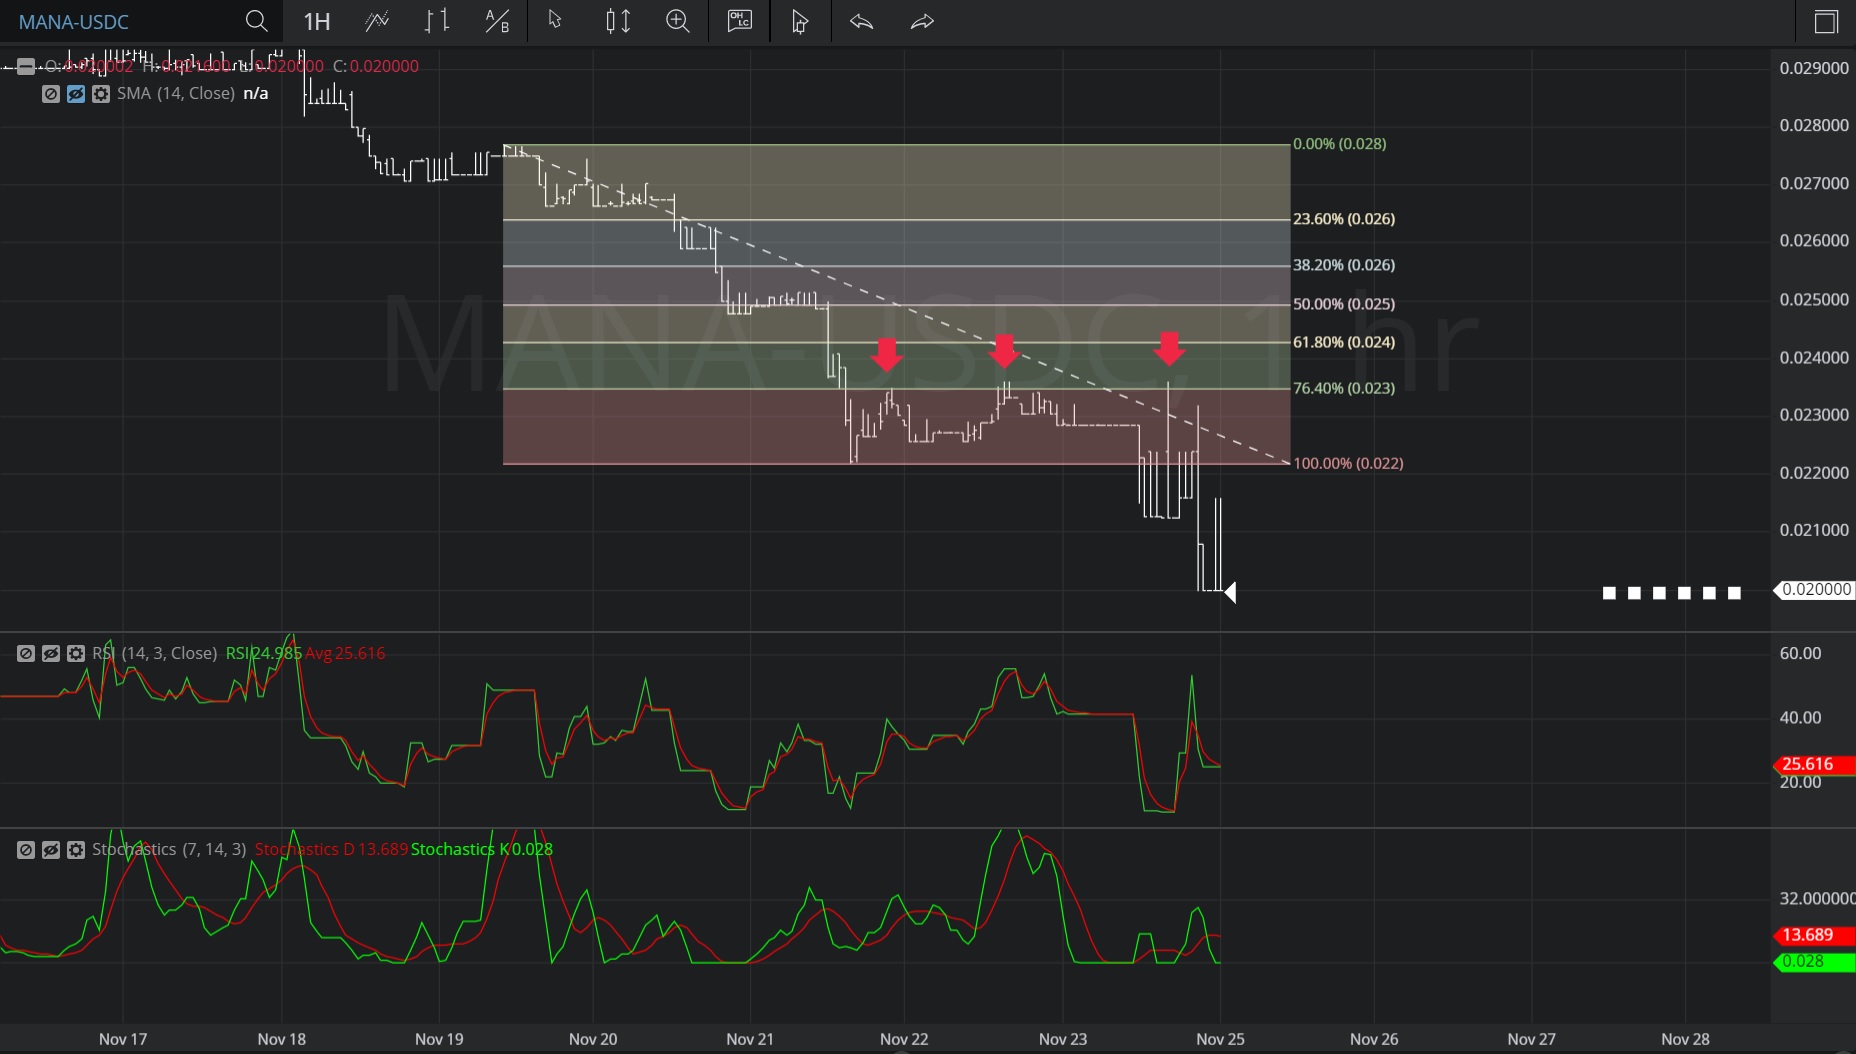
In this Hourly chart of Decentraland/ USD Coin (MANA/USDC), there is a depreciating range from 0.02767 to 0.022211.
We can see the market then appreciated to the 0.023502, 0.023604, and 0.023610 levels (each identified by the red down arrow), all of which are right around the 0.023499 area, representing the 23.6% retracement of the depreciating range.
The market then depreciated further and tested the 0.0200 level.
Using RSI, we can see that some price appreciation and short-covering occurred when RSI (14) crossed above RSI Average (3).
Using Slow Stochastics, we can see that some price appreciation and short-covering occurred when Stochastics K crossed above Stochastics D.
Stay on top of the cryptocurrency market with CryptoDaily’s trading charts!
https://charts.cryptodaily.net/
Investment Disclaimer