Published
4 years ago on
November 01, 2019
Bitcoin
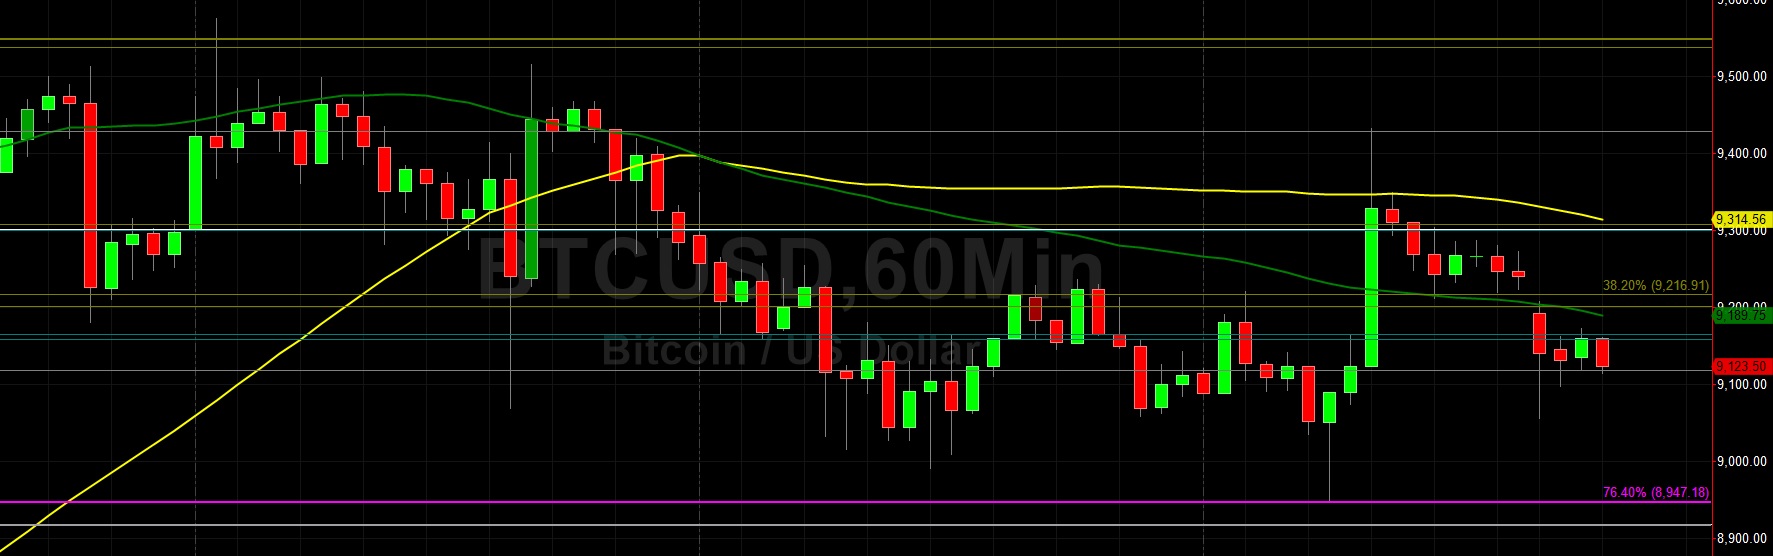
Bitcoin (BTC/USD) moved lower early in today’s Asian session as the pair receded back to the 9055.93 area after appreciating to the 9433.00 level during yesterday’s North American session. The pair has continued to drift lower from 28 October following its peak around the 9939.69 area, absorbing some areas of technical Support along the way. This includes the 9301.26 area, representing the 38.2% retracement of the 7296.44 – 10540.49 area. The level has since become technical Resistance during the past few trading sessions, leading to speculation that BTC/USD is headed lower. Below this area, the 8918.47 area represents the 50% retracement of this range, and Stops are likely in place below this level.
Chartists are observing that the 50-bar MA (4-hourly) continues to move higher and is now indicating above the 8688.03 level area, representing the 38.2% retracement of the 10939.34 – 7296.44 range. This could provide some technical Support ahead of any attempt by BTC/USD Bears to seek Stops below the 8688 area. If the 8918 and 8688 areas become Given, traders will begin to focus on the 8535.67 area for possible technical Support, representing the 61.8% retracement of the aforementioned 7296.44 – 10540.49 range.
Price activity is nearest the 50-bar MA (4-hourly) at 8,890.95 and the 50-bar MA (Hourly) at 9,189.96.
Technical Support is expected around 8918.47/ 8535.67/ 8062.04 with Stops expected below.
Technical Resistance is expected around 9774.89/ 10540.49/ 10939.34 with Stops expected above.
On 4-Hourly chart, SlowK is Bearishly below SlowD while MACD is Bearishly below MACDAverage.
On 60-minute chart, SlowK is Bearishly below SlowD while MACD is Bearishly below MACDAverage.
Ethereum
Ethereum (ETH/USD) was slightly weaker early in today’s Asian session as the pair depreciated to the 180.08 area after peaking around the 185.08 level during yesterday’s North American session. During yesterday’s European session, ETH/USD Bears pushed the pair lower to the 177.81 area, just above the 50-bar MA (4-hourly) and 200-bar MA (4-hourly). Below those indicators, the 100-bar MA (4-hourly) is currently indicating right around the 176.28 area, a level that is right around the 50% retracement of the 153.00 – 199.50 range.
Some Stops are likely in place below this level, and if it is breached it opens up a possible test of the 170.76 area, representing the 61.8% retracement of the aforementioned range. Before a possible test of that level, however, ETH/USD Bears may have to contend with some possible buying pressure between the 172.72 – 173.86 range. Another clue regarding the weakening market sentiment is the recent convergence involving the 50-bar MA (hourly) and the 100-bar MA (hourly), a development that may lead to additional weakness given the crossover of the latter above the former. Chartists continue to observe the 172.88 area as being important, representing the 38.2% retracement of the 322.16 – 80.60 range.
Price activity is nearest the 200-bar MA (4-hourly) at 177.07 and the 50-bar MA (Hourly) at 185.50.
Technical Support is expected around 180.05/ 175.04/ 169.63 with Stops expected below.
Technical Resistance is expected around 193.41/ 199.50/ 202.38 with Stops expected above.
On 4-Hourly chart, SlowK is Bullishly above SlowD while MACD is Bearishly below MACDAverage.
On 60-minute chart, SlowK is Bearishly below SlowD while MACD is Bullishly above MACDAverage.
Investment Disclaimer