Published
4 years ago on
November 15, 2019
Bitcoin
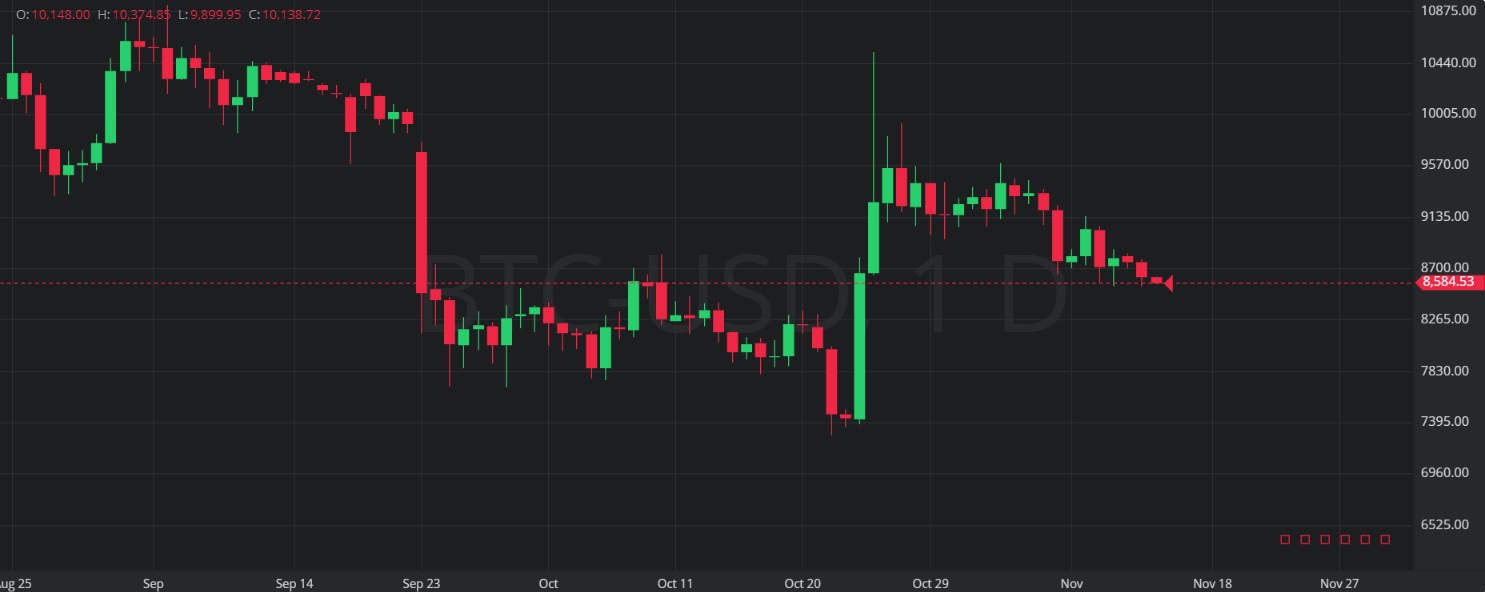
Bitcoin (BTC/USD) depreciated to the 8572.00 level early in today’s Asian session as the pair extended its selling pressure that began around the 8784.61 level during yesterday’s Asian session. Over the past few trading sessions, traders have kept the pair bid above the 8535.67 area, representing the 61.8% retracement of the move from 7296.44 to 10540.49. Despite the quick ascent higher to the 9150.00 level on 10 November, BTC/USD has generally remained Given below the 8918.47 area, representing the 50% retracement of the aforementioned range. Traders have noted the pair is also continuing to orbit the 200-bar MA (4-hourly), and the 100-bar MA (4-hourly) continues to trade above the 50-bar MA (4-hourly), a Bearish signal.
Traders also note that price activity continues to trade below the 50-bar MA (hourly), 100-bar MA (hourly), and 200-bar MA (hourly), another Bearish signal indicating the pair’s weakness. Below current market activity, traders cite buying pressure around the 8338.78 area, representing the 76.4% retracement of the 9948.12 – 3128.89 range. Above current market activity, traders cite some selling pressure around the 8847.43 area, representing the 23.6% retracement of the move from 13868.44 to 7296.44. Some Stops are likely in place above the 8947.18 level.
Price activity is nearest the 200-bar MA (4-hourly) at 8,686.47 and the 50-bar MA (Hourly) at 8,695.04.
Technical Support is expected around 8502.35/ 8062.04/ 7343.17 with Stops expected below.
Technical Resistance is expected around 9130.00/ 9378.16/ 9774.89 with Stops expected above.
On 4-Hourly chart, SlowK is Bearishly below SlowD while MACD is Bearishly below MACDAverage.
On 60-minute chart, SlowK is Bearishly below SlowD while MACD is Bullishly above MACDAverage.
Ethereum
Ethereum (ETH/USD) weakened to the 183.01 level early in today’s Asian session as the pair has been pressured lower since Wednesday’s North American session. Traders note that the pair continues to trade above the 181.74 area, a key area that represents the 38.2% retracement of the 153.00 – 199.50 range. The pair briefly traded below this range on 9 November when traders tested the 100-bar MA (4-hourly) and the pair has since orbited this indicator, with a recent high of 192.00. Technicians note that if the pair is going to make progress above the current market, it must challenge the 193.45 area, representing the 76.4% retracement of the move from 199.50 to 173.86.
In the short-term, the pair is looking for direction as evidenced by the recent convergence of the 50-bar MA (hourly), 100-bar MA (hourly), and 200-bar MA (hourly). Some technical headwinds are therefore expected through the 186.50 area. Another level that traders are watching is the 190.80 area, representing the 23.6% retracement of the move from 547.54 to 80.60, a very important range. Below current market activity, the 180.45 area represents the 38.2% retracement of the move from 152.11 to 197.97. Some Stops are thought to be in place below the 179.91 area.
Price activity is nearest the 100-bar MA (4-hourly) at 185.26 and the 50-bar MA (Hourly) at 185.72.
Technical Support is expected around 180.43/ 177.39/ 175.02 with Stops expected below.
Technical Resistance is expected around 187.66/ 191.32/ 194.60 with Stops expected above.
On 4-Hourly chart, SlowK is Bearishly below SlowD while MACD is Bearishly below MACDAverage.
On 60-minute chart, SlowK is Bearishly below SlowD while MACD is Bullishly above MACDAverage.
Investment Disclaimer