Published
4 years ago on
November 18, 2019
Bitcoin
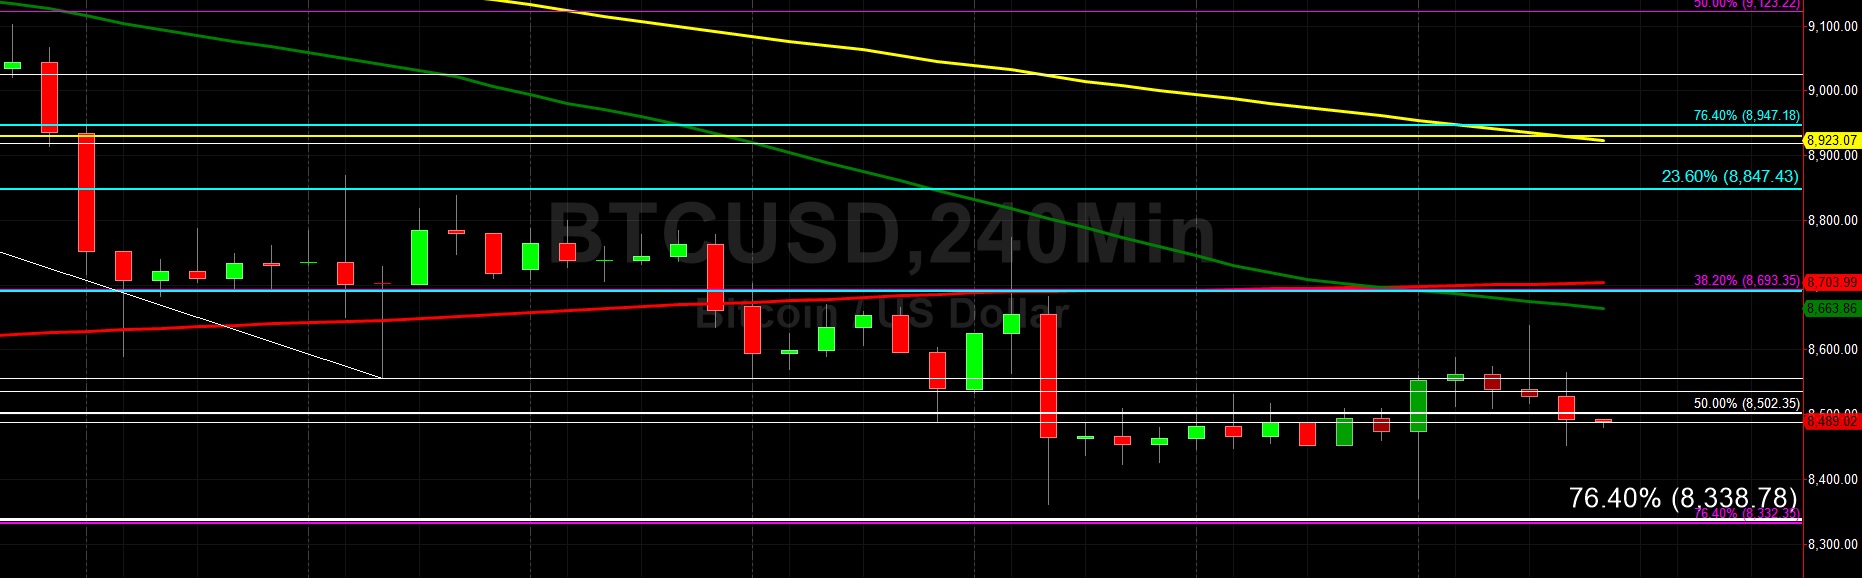
Bitcoin (BTC/USD) moved lower to the 8452.71 level early in today’s Asian session after trading as high as the 8637.01 area during yesterday’s North American session. During yesterday’s European session, the pair depreciated to the 8371.02 area, above technical Support expected around the 8338.78 area. Traders have continued to manage market risk with a Bearish bias following the pair’s steady erosion from the recent high of 10540.49 in late October. Given the pair’s recent weakness and range expansion, some technical traders are focusing on longer-term ranges and their impact on BTC/USD. Above current market activity, the 9301.26 area represents the 38.2% retracement of the 7296.44 – 10540.49 range. That area is also near another important retracement level, namely the 9269.57 level that represents the 50% retracement of the broader 4670.69 – 13868.44 range.
Below current market activity, the next retracement level related to this broader range is the 8184.23 area, and some decent Stops are likely in place below. Longer-term BTC/USD traders also observed that earlier this month that market activity recently orbited the 9385.99 area, the 61.8% retracement level of another range, specifically the move from 6615.28 to 13868.44. Below that level, the 8327.03 area represents the 76.4% retracement of that range and provided technical Support late last week. Stops were recently triggered below the 8535.67 level during the pair’s move lower late last week, a level that represents the 61.8% retracement of the late-October 7296.44 – 10540.49 range. The next downside level of potential technical Support related to this range is the 8062.04 area, representing the 76.4% retracement.
Price activity is nearest the 50-bar MA (4-hourly) at 8,663.84 and the 50-bar MA (Hourly) at 8,492.88.
Technical Support is expected around 8338.78/ 8062.04/ 7343.17 with Stops expected below.
Technical Resistance is expected around 9130.00/ 9378.16/ 9774.89 with Stops expected above.
On 4-Hourly chart, SlowK is Bullishly above SlowD while MACD is Bullishly above MACDAverage.
On 60-minute chart, SlowK is Bearishly below SlowD while MACD is Bearishly below MACDAverage.
Ethereum
Ethereum (ETH/USD) depreciated to the 183.20 level early in today’s Asian session after trading as high as the 186.26 area during yesterday’s North American session. The pair’s test of recent lows around the 177.00 figure has some traders reassessing market risk with a downward bias, noting that the pair has gradually weakened from its late-October high around the 199.50 area. ETH/USD has evidenced some relative resilience, however, and some traders remain neutral with regard to market sentiment while the pair remains Bid above the 176.25 area, representing the 50% retracement of the recent 153.00 – 199.50 range.
Given the gradual yet ongoing recent range expansion, traders are monitoring another very important broader range, namely the 122.75 – 364.49 range. Notably, the 179.80 area represents the 76.4% retracement of this range, with the 215.09 area representing the 61.8% retracement of the range far above the psychologically-important 200.00 figure. Longer-term ETH/USD traders and market technicians are also keeping tabs on the much broader 100.15 – 364.49 range, where the 201.10 and 162.52 areas represent the 61.8% and 76.4% retracements.
Price activity is nearest the 50-bar MA (4-hourly) at 184.65 and the 100-bar MA (Hourly) at 182.95.
Technical Support is expected around 176.25/ 175.02/ 170.76 with Stops expected below.
Technical Resistance is expected around 187.66/ 191.32/ 194.60 with Stops expected above.
On 4-Hourly chart, SlowK is Bearishly below SlowD while MACD is Bullishly above MACDAverage.
On 60-minute chart, SlowK is Bearishly below SlowD while MACD is Bearishly below MACDAverage.
Investment Disclaimer