Published
4 years ago on
November 02, 2019
Bitcoin
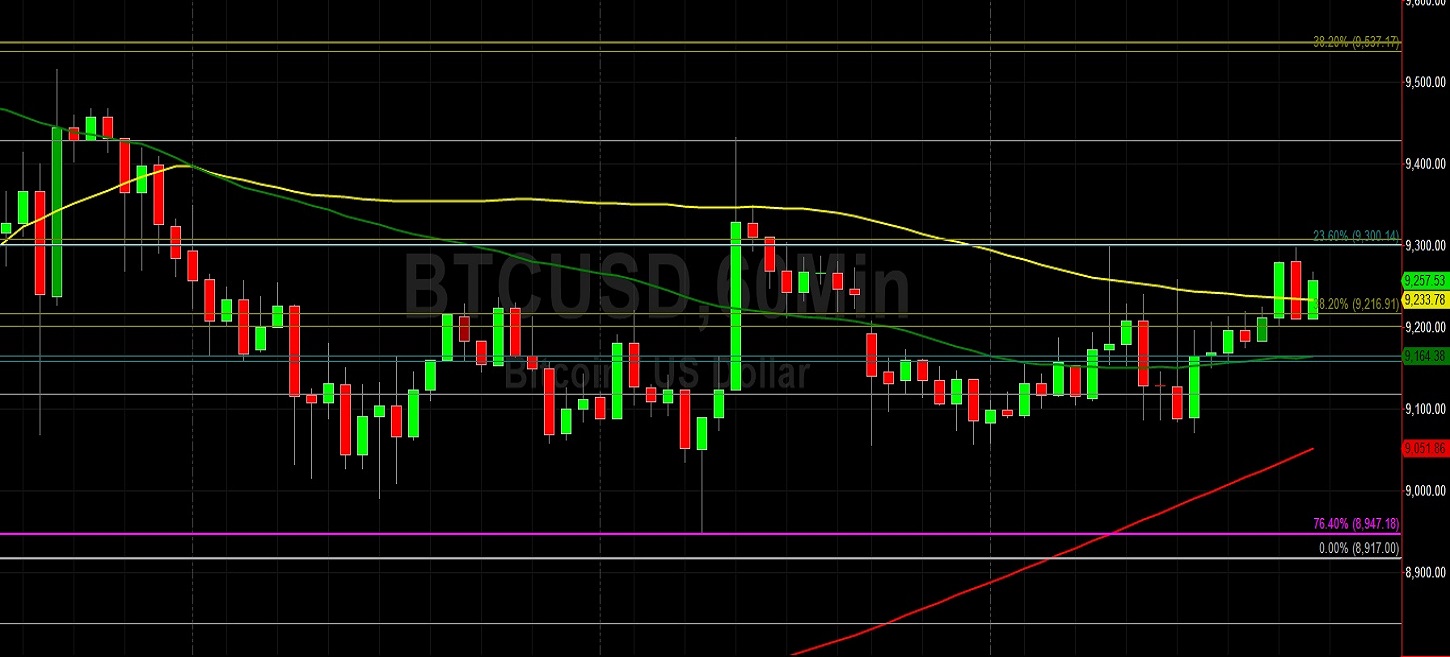
Bitcoin (BTC/USD) appreciated to the 9296.98 level in today’s Asian session as the pair was lifted from the 9085.00 area during yesterday’s North American session. Following the pair’s recent move lower to the 8950.00 level during Thursday’s North American session, the pair quickly rebounded to the 9433.00 level before coming off and finding technical Support just below the 9063.99 area, representing the 76.4% retracement of this relative low and relative high. Selling pressure emerged during yesterday’s North American session right around the 9300.14 area, representing the 23.6% retracement of the 10540.49 – 8917.00 range.
Stops were elected above the 100-bar MA (hourly) during the move higher yesterday to the 10540.49 area, then indicating around the 9258.64 area. The 100-bar MA (hourly) is now indicating above the 50-bar MA (hourly) and chartists are observing market activity to see if BTC/USD can build a constructive base above the 50-bar MA (hourly). Notably, the 200-bar MA (hourly) is now indicating just above the 8947.18 area, an important level that was technical Support during Thursday’s European session. Below current market activity, traders expect buying pressure around the 8929 and 8688 levels. Above current market activity, traders expect selling pressure around the 9430, 9532, and 9585 levels.
Price activity is nearest the 50-bar MA (4-hourly) at 9,061.73 and the 100-bar MA (Hourly) at 9,233.63.
Technical Support is expected around 8918.47/ 8535.67/ 8062.04 with Stops expected below.
Technical Resistance is expected around 9774.89/ 10540.49/ 10939.34 with Stops expected above.
On 4-Hourly chart, SlowK is Bullishly above SlowD while MACD is Bearishly below MACDAverage.
On 60-minute chart, SlowK is Bullishly above SlowD while MACD is Bullishly above MACDAverage.
Ethereum
Ethereum (ETH/USD) gained ground early in today’s Asian session as the pair escalated to the 184.99 area after trading as low as the 177.39 area during yesterday’s North American session. Traders continue to observe the pair’s attempt to establish a market bias. During Thursday’s European session, buying pressure emerged around the 177.81 area, then right around the levels at which the 50-bar MA (4-hourly), 100-bar MA (4-hourly), and 200-bar MA (4-hourly) were trading. The 50-bar MA (4-hourly) has since crossed above the 200-bar MA (4-hourly) and has remained supportive of market activity.
The 183.65 area has been toppish since this recent test of technical Support, however, and this area represents the 38.2% retracement of the 199.50 – 173.86 range. Price activity is also orbiting the 50-bar MA (hourly) and the 50-bar MA (hourly) is trading below the 100-bar MA (hourly) and above the 200-bar MA (hourly). Below current market activity, traders anticipate some buying pressure between the 176.60 – 178.40 range, with some additional technical Support possible around the 175.47 area. Above current market activity, traders anticipate some selling pressure around the 186.00 figure and 187.12 level.
Price activity is nearest the 50-bar MA (4-hourly) at 181.06 and the 100-bar MA (Hourly) at 184.03.
Technical Support is expected around 177.39/ 175.04/ 169.63 with Stops expected below.
Technical Resistance is expected around 193.41/ 199.50/ 202.38 with Stops expected above.
On 4-Hourly chart, SlowK is Bullishly above SlowD while MACD is Bearishly below MACDAverage.
On 60-minute chart, SlowK is Bearishly below SlowD while MACD is Bullishly above MACDAverage.
Investment Disclaimer