Published
4 years ago on
November 21, 2019
Bitcoin
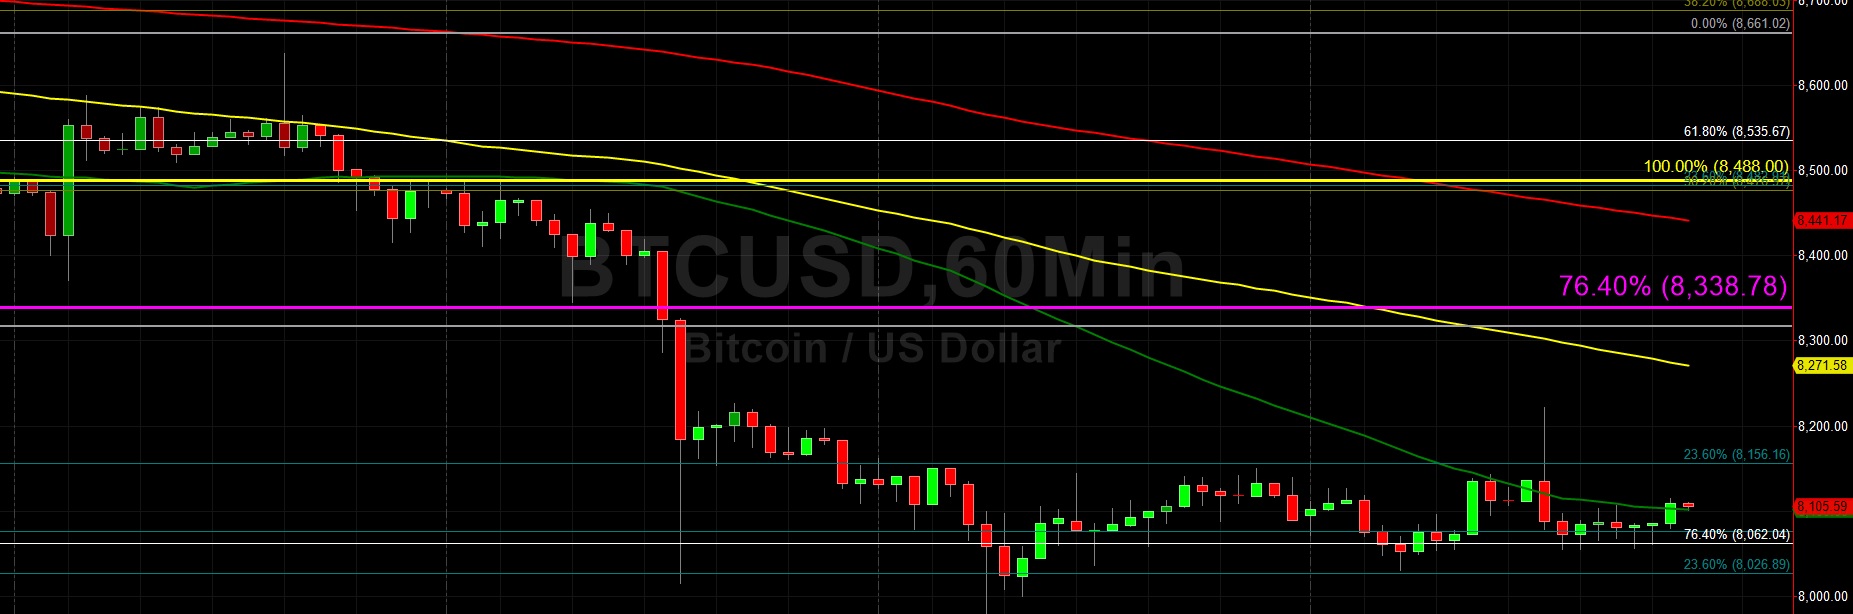
Bitcoin (BTC/USD) was little-changed early in today’s Asian session as the pair traded around the 8094.11 level after trading as low as the 8030.05 area during yesterday’s European session. The pair continues to orbit the 8062.04 area, representing the 76.4% retracement of the move from 7296.44 to 10540.49. Traders are waiting to see if the pair is able to reclaim the 8157.42 area, a level that represents the 23.6% retracement of the move from 10944.67 to 7296.44. Above that area, the 8184.23 level represents another area of potential selling pressure, and the 61.8% retracement of the 4670.69 – 13868.44 range. Market technicians note that the 50-bar MA (hourly) provided technical Resistance during yesterday’s North American session.
Given the pair’s rapid ascent to the 10540.49 area in late October, traders note there does not appear to be too much technical buying pressure between current levels and the 7296.44 area that provided technical Support late last month. Traders anticipate some Stops being in place below this level and if it is tested, some buying pressure could be in place between 7084 and 7235. Below that level, chartists are observing the 6841.36 area as another downside target, representing the 76.4% retracement of the 4670.69 – 13868.44 range.
Price activity is nearest the 50-bar MA (4-hourly) at 8,420.24 and the 50-bar MA (Hourly) at 8,102.55.
Technical Support is expected around 7990.06/ 7343.17 / 7296.44 with Stops expected below.
Technical Resistance is expected around 8338.78/ 9130.00/ 9378.16 with Stops expected above.
On 4-Hourly chart, SlowK is Bullishly above SlowD while MACD is Bullishly above MACDAverage.
On 60-minute chart, SlowK is Bullishly above SlowD while MACD is Bullishly above MACDAverage.
Ethereum
Ethereum (ETH/USD) gained slight ground early in today’s Asian session as the pair escalated to the 175.29 area after trading as low as the 173.26 area during yesterday’s North American session. Traders are carefully observing trading activity around the 176.25 area, representing the 50% retracement of the move from 153.00 to 199.50. Stops were elected below this level during the pair’s recent move to the 172.38 area. Another important area during the recent depreciation was the 172.72 area, representing the 23.6% retracement of the 239.45 – 152.11 range.
Also, the 179.80 area is another important level that represents the 76.4% retracement of the 122.75 – 364.49 range, and the level’s significance was reaffirmed this week when Stops were triggered during the move lower. Chartists note that the pair briefly traded above the 50-bar MA (hourly) during yesterday’s North American session. The 200-bar MA (4-hourly) is currently indicating below the 181.00 area and this may prove to be a technical challenge for the pair on its next move higher. Longer-term ETH/USD traders and market technicians are also keeping tabs on the much broader 100.15 – 364.49 range, where the 162.50 area represents the 76.4% retracement.
Price activity is nearest the 200-bar MA (4-hourly) at 180.71 and the 50-bar MA (Hourly) at 175.39.
Technical Support is expected around 172.38/ 170.76/ 167.80 with Stops expected below.
Technical Resistance is expected around 180.43/ 183.33/ 187.12 with Stops expected above.
On 4-Hourly chart, SlowK is Bullishly above SlowD while MACD is Bullishly above MACDAverage.
On 60-minute chart, SlowK is Bullishly above SlowD while MACD is Bullishly above MACDAverage.
Investment Disclaimer