
Published
4 years ago on
November 22, 2019
Bitcoin
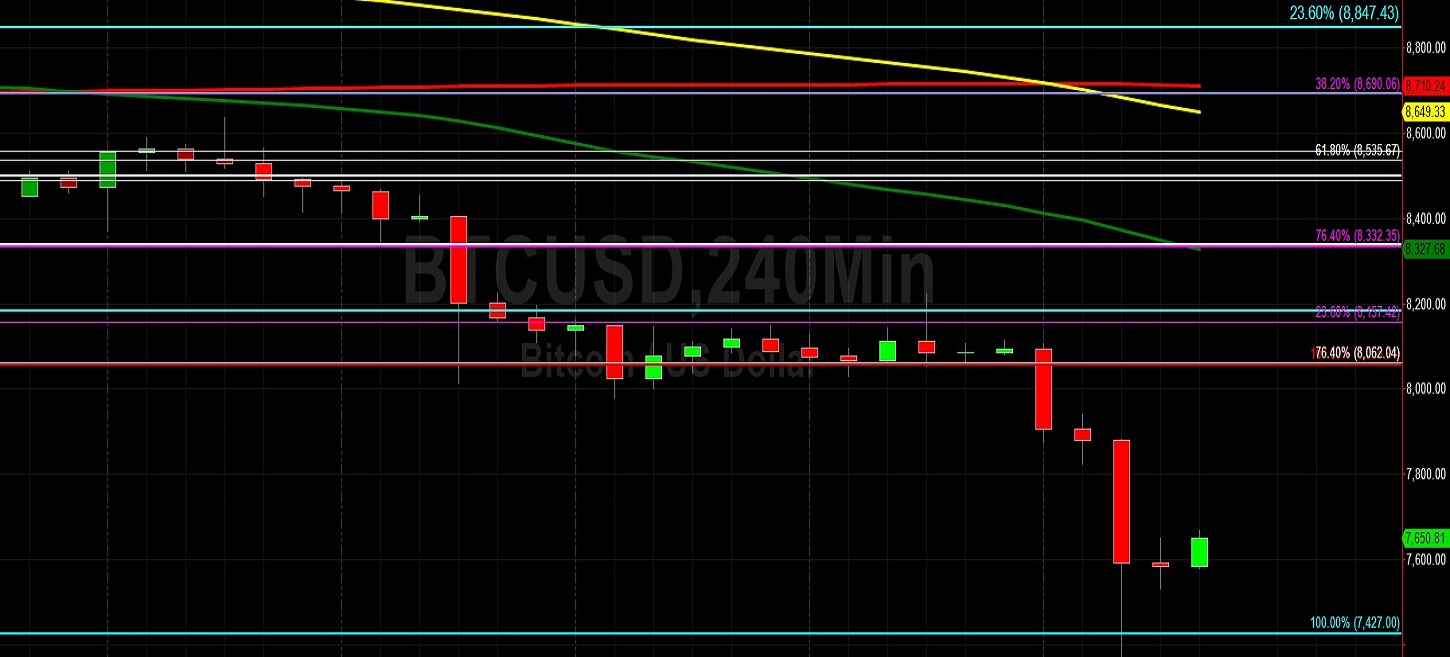
Bitcoin (BTC/USD) was a little stronger early in today’s Asian session after the pair traded as low as the 7374.50 area during yesterday’s North American session. Stops were elected below the 7427.00 area during the pair’s move to November monthly lows. Traders continue to observe the pair trading between some important long-term technical levels, namely the 8498.67 and 7231.40 areas which represent the 50% and 61.8% retracements of the move from 3128.89 to 13868.44. A break of the 7231.40 area technically opens up the 5663.42 area, representing the 76.4% retracement of the same range. Likewise, a break of the 8498.67 area opens up the 9765.93 area, representing the 38.2% retracement of the same range.
Another important technical level is the 8184.23 area, representing the 61.8% retracement of the move from 4670.69 to 13868.44. Below that area, the 6841.36 area is notable technical Support and above that area, the 9269.57 area represents the 50% retracement of the range. Market technicians are noting that the 50-bar MA (4-hourly) is now converging with the 100-bar MA (4-hourly), a Bearish development that could lead to additional technical weakness. Traders continue to eye the 7296.44 area as recent technical Support, with some buying pressure possible between the 7084 and 7235 levels if that level is breached.
Price activity is nearest the 50-bar MA (4-hourly) at 8,327.16 and the 50-bar MA (Hourly) at 7,964.30.
Technical Support is expected around 7343.17 / 7296.44/ 6810.00 with Stops expected below.
Technical Resistance is expected around 8062.04/ 8338.78/ 8535.67 with Stops expected above.
On 4-Hourly chart, SlowK is Bullishly above SlowD while MACD is Bearishly below MACDAverage.
On 60-minute chart, SlowK is Bullishly above SlowD while MACD is Bearishly below MACDAverage.
Ethereum
Ethereum (ETH/USD) appreciated modestly in today’s Asian session as the pair escalated to the 161.09 area after trading as low as the 155.00 area during yesterday’s North American session. Stops were elected below the 165.25 area during the pair’s descent, a level that represents the 38.2% retracement of the 302.20 – 80.60 range. The pair finally gave way below the 176.25 area, a level that represents the 50% retracement of the move from 153.00 to 199.50. Additional Stops were triggered below the 169.63 and 162.93 areas during the pair’s move lower to its weakest print this month. Traders anticipate some Stops are in place below the 153.00 figure.
After the 163.97 area and 162.93 area were breached, chartists again focused on the 153.00 and 152.11 areas following tests of these levels in late September and late October. Given the pair’s downward pressure, chartists are focusing on levels including the 147.60 area, representing the 76.4% retracement of the move from 80.60 to 364.49. Some Stops are likely in place below the 141.78 area, and longer-term ETH/USD Bears are eyeing technical Support around the 132.90 area.
Price activity is nearest the 50-bar MA (4-hourly) at 178.84 and the 50-bar MA (Hourly) at 171.26.
Technical Support is expected around 153.00/ 147.60/ 132.90 with Stops expected below.
Technical Resistance is expected around 170.13/ 174.80/ 179.47 with Stops expected above.
On 4-Hourly chart, SlowK is Bullishly above SlowD while MACD is Bearishly below MACDAverage.
On 60-minute chart, SlowK is Bullishly above SlowD while MACD is Bearishly below MACDAverage.
Investment Disclaimer


