Published
4 years ago on
November 25, 2019
Bitcoin
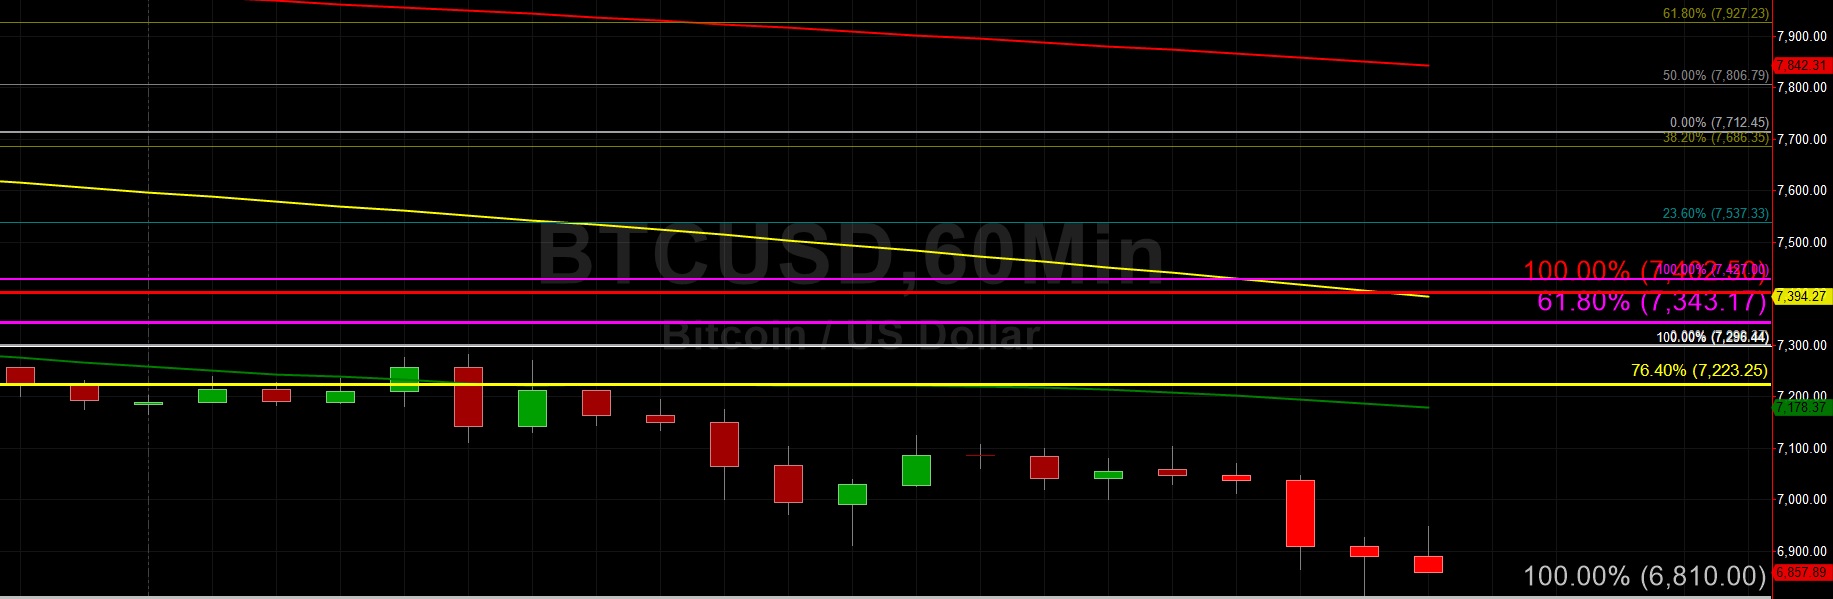
Bitcoin (BTC/USD) moved lower early in today’s Asian session as the pair sank to the 6804.00 level late in yesterday’s North American session following steady selling pressure from the 7361.41 level during Saturday’s North American session. The pair’s recent downward range expansion has shifted focus to some longer-term price ranges and related retracement levels that could soon become more relevant given the ongoing deterioration in market sentiment. After the market moved below the 7427 and 7296 areas and traders had Stops elected below the 6899 area, focus has shifted on downside market levels that have now come into view and could be targeted. Many traders will retain their Bearish sentiment as long as the pair continues to orbit levels like the 7084, 7296, and 7427 areas.
Notably, the 6620.61 level represents a relative historic low and if it is breached, BTC/USD Bears would focus on the 5663.42 area, representing the 76.4% retracement of the 3128.89 – 13868.44 range. One even broader range that longer-term chartists are focusing on is the 19891.99 – 3128.89 range. After the market crashed below the 9532.39 area, representing the 38.2% retracement of that range, traders began focusing on the 7084.98 area, representing the 23.6% retracement of the same range. Likewise, another important range is the move from 3128.89 to 13868.44 and the pair’s recent move below the 8498.67 area opened up the 7231.40 area as another important focal point. Similarly, the move from 4670.69 to 13868.44 is technically significant. The pair’s recent depreciation below the 8184.23 area has technically opened up the 6841.36 level as a downside target.
Price activity is nearest the 50-bar MA (4-hourly) at 7,808.14 and the 50-bar MA (Hourly) at 7,179.57.
Technical Support is expected around 6775.47/ 6653.57/ 6323.42 with Stops expected below.
Technical Resistance is expected around 7343.17/ 8062.04/ 8338.78 with Stops expected above.
On 4-Hourly chart, SlowK is Bearishly below SlowD while MACD is Bearishly below MACDAverage.
On 60-minute chart, SlowK is Bearishly below SlowD while MACD is Bearishly below MACDAverage.
Ethereum
Ethereum (ETH/USD) weakened early in today’s Asian session as the pair dipped to the 138.01 level following steady selling pressure that emerged around the 154.54 area during Saturday’s North American session. Following the pair’s decisive break below the 191.40 area earlier this month, traders adopted an increasingly bearish market bias that intensified after the pair tested and traded below the 165.25 area, depreciating as low as the 137.80 area prior to today’s price activity. Notably, Stops were elected below the 191.40 level and 165.25 areas and this is important because they represent the 50% and 38.2% retracements of the 302.20 to 80.60 range. Importantly, the next downside level related to this range is the 132.90 area, representing the 23.6% retracement of the range.
Below the 132.90 area, some chartists are anticipating some buying pressure between the 130.05 and 130.39 areas. Thereafter the 125.16 level is technically relevant as it represents the 61.8% retracement of the move from 100.15 to 165.62. Additional technical Support could emerge around other important downside price targets between the 120.61 and 122.75 levels. Some traders believe ETH/USD could be oversold around current market levels, and some upside price retracement levels now include the 152.36, 161.37, and 168.65 areas that represent the 38.2%, 50%, and 61.8% retracements of the 199.50 – 137.80 range.
Investment Disclaimer