Published
4 years ago on
November 26, 2019
Bitcoin
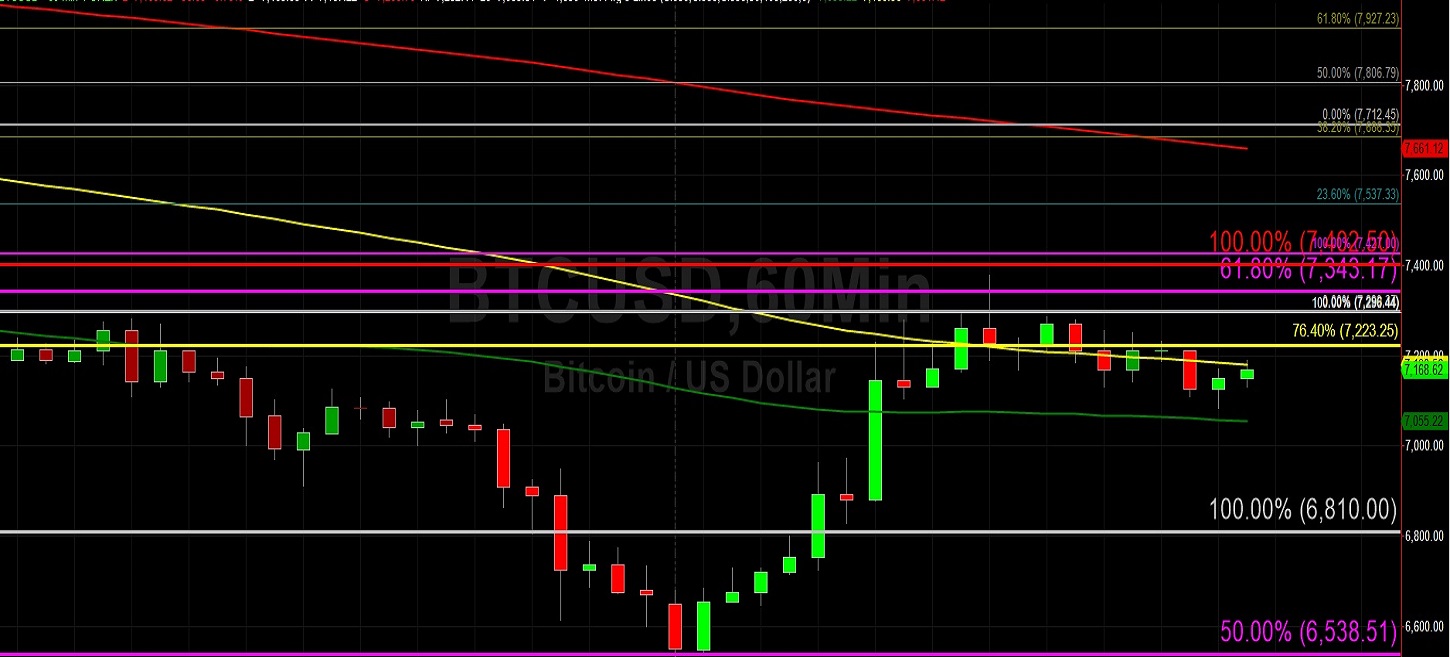
Bitcoin (BTC/USD) moved higher early in today’s Asian session as the pair traded up around the 7169.02 area after trading as high as the 7379.99 area during yesterday’s North American session. During yesterday’s Asian session, the pair traded as low as the 6526.00 area after tumbling through some key technical areas. Market sentiment has deteriorated rapidly over the last several days, a development that intensified yesterday when traders pushed the pair below the 6653 level, a downside price objective that gave way and saw the pair fall to the 6526.00 area. Stops were also elected below the 6857 and 6775 areas during the downturn, and this saw the pair decline to its weakest print since May of this year. The pair has now declined from its 10540.49 peak in late October, giving back a peak-to-trough 37.2% in the process.
Below current market activity, BTC/USD Bears are focusing on some additional downside price objectives, including the 6323 and 6038 areas. Notably, BTC/USD Bears continue to focus on the 4748 area as an important downside price objective. Also, the 6538.51 area is one level that traders are carefully monitoring, as it represents the 50% retracement of the 9948.12 – 3128.89 range. Below that area, the 6440.82 area is also technically significant as it represents the 61.8% retracement of the 8488.00 – 3128.89 range. An extension of the pair’s recent bearishness will open up additional downside price targets including the 5808 and 5733 levels, with the latter right around the 38.2% retracement of the aforementioned move from 9948.12 to 3128.89. Likewise, the 5663.42 area is also technically significant as it represents the 76.4% retracement of the move from 3128.89 to 13868.44.
Price activity is nearest the 50-bar MA (4-hourly) at 7631.20 and the 100-bar MA (Hourly) at 7,180.36.
Technical Support is expected around 6775.47/ 6653.57/ 6323.42 with Stops expected below.
Technical Resistance is expected around 7537.33/ 8062.04/ 8338.78 with Stops expected above.
On 4-Hourly chart, SlowK is Bearishly below SlowD while MACD is Bullishly above MACDAverage.
On 60-minute chart, SlowK is Bearishly below SlowD while MACD is Bullishly above MACDAverage.
Ethereum
Ethereum (ETH/USD) slid to the 144.32 level early in today’s Asian session after the pair traded as high as the 151.69 area during yesterday’s North American session. Market bias has become increasingly negative during recent trading sessions as the pair depreciated to the 131.80 area during yesterday’s Asian session after Stops were elected below the 137.80 area. Traders had focused on the 132.90 area as a major downside price objective for the pair, representing the 23.6% retracement of the 302.20 – 80.60 range, and Stops were triggered below during yesterday’s move. Below that level, the 122.75 area is also coming into view, and may provide some technical Support.
Technicians have been very attentive to the pair’s ongoing depreciation from its print around the 199.50 area in late October. Several clues emerged as the pair tested technical Resistance around the 192, 186, and 177 areas and failures around these levels led to Stops being elected below the 168 and 165 levels, key downside price objectives that hastened the slide to the 156 and 152 areas. When ETH/USD Bears continued their onslaught, Stops were elected below the 143 and 140 areas. Longer-term traders are now eyeing the 127 and 104 areas as downside price objectives. Potential areas of technical Support include 130.05, 125.16, and 122.75.
Price activity is nearest the 50-bar MA (4-hourly) at 161.40 and the 50-bar MA (Hourly) at 145.14.
Technical Support is expected around 131.80/ 125.16/ 122.75 with Stops expected below.
Technical Resistance is expected around 161.37/ 163.60/ 165.25 with Stops expected above.
On 4-Hourly chart, SlowK is Bearishly below SlowD while MACD is Bullishly above MACDAverage.
On 60-minute chart, SlowK is Bearishly below SlowD while MACD is Bullishly above MACDAverage.
Investment Disclaimer