Published
4 years ago on
November 03, 2019
Bitcoin
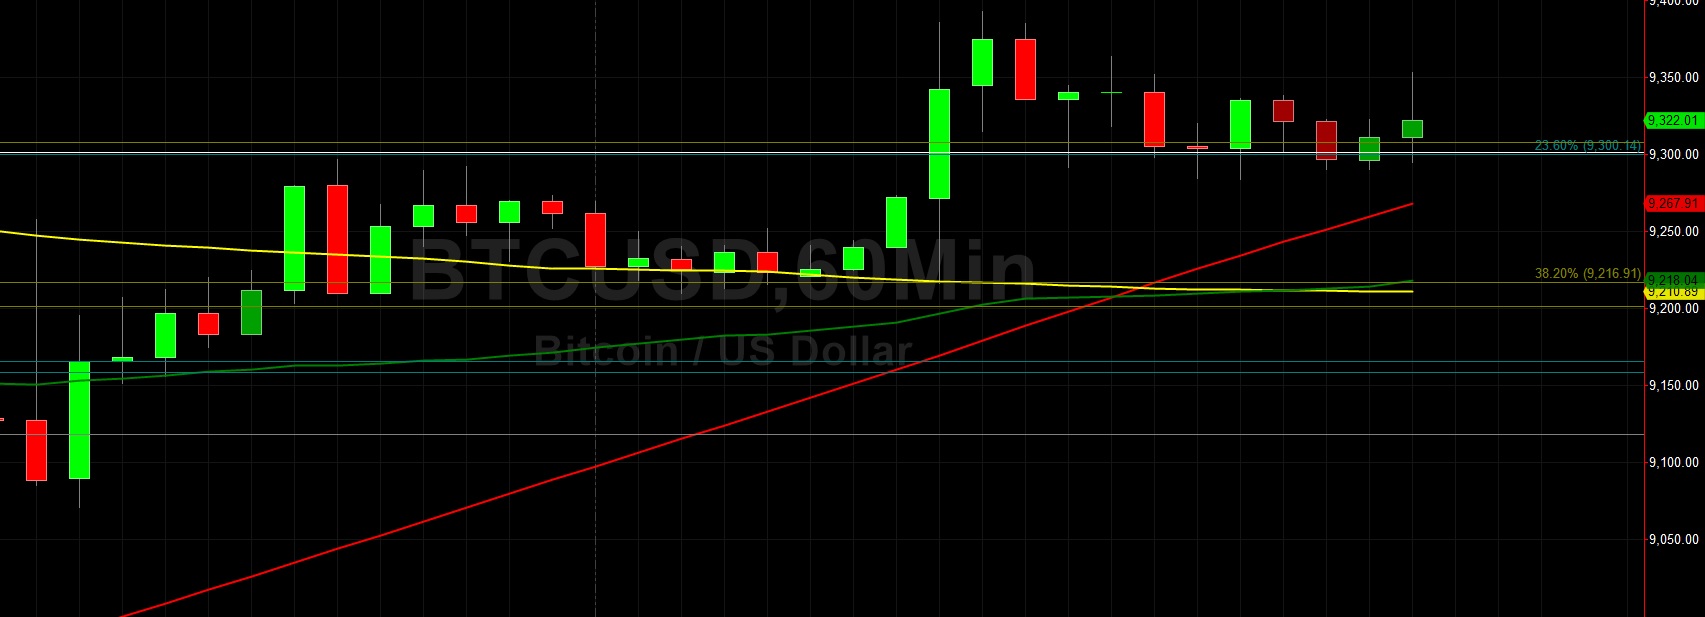
Bitcoin (BTC/USD) drifted higher early in today’s Asian session as the pair traded as high as the 9363.82 area after being supported around the 9210.00 level during yesterday’s European session. The pair continues to seek market direction following its spike to the 10540 area on 26 October, a move that was abrupt and quickly saw BTC/USD settle back around the 8918.47 area, representing the 50% retracement of the 7296.44 – 10540.49 range. Following that retracement, the pair has only once traded above the 9774.89 area, representing the 23.6% retracement of that range, and has generally orbited the 9301.26 area, representing the 38.2% retracement.
BTC/USD has generally been capped around that area during the several past trading sessions, unable to move through technical Resistance. The 50-bar MA (4-hourly) is now indicating just below that important 9301.26 area and that may help traders trying to absorb Offers above that area. The 50-bar MA (hourly) and 100-bar MA (hourly) are also converging and if the 50-bar MA (hourly) crosses above, it may yield some positive upside gains. Below current market activity, traders expect buying pressure around the 8929 and 8688 levels. Above current market activity, traders expect selling pressure around the 9430, 9532, and 9585 levels.
Price activity is nearest the 50-bar MA (4-hourly) at 9,262.74 and the 200-bar MA (Hourly) at 9,267.93.
Technical Support is expected around 8918.47/ 8535.67/ 8062.04 with Stops expected below.
Technical Resistance is expected around 9774.89/ 10540.49/ 10939.34 with Stops expected above.
On 4-Hourly chart, SlowK is Bullishly above SlowD while MACD is Bullishly above MACDAverage.
On 60-minute chart, SlowK is Bullishly above SlowD while MACD is Bearishly below MACDAverage.
Ethereum
Ethereum (ETH/USD) weakened early in today’s Asian session as the pair fell back to the 182.12 level after peaking around the 186.19 area during yesterday’s North American session. Market sentiment remains quite uncertain with the pair having traded between the 193.41 and 177.39 area following its spike to the 199.50 area on 26 October and subsequent pullback to the 173.86 area. The 200-bar MA (hourly) recently crossed above the 50-bar MA (hourly), an event that typically results to at least some price depreciation, and is bearishly converging with the 100-bar MA (hourly). Traders have been able to keep the pair above the 176.25 area following the depreciation from the 193.41 area, a notable achievement because the 176.25 level represents the 50% retracement of the 153.00 – 199.50 range.
ETH/USD has generally traded around the 181.74 area following the recent move lower from 199.50 to 173.86, and this level is the 38.2% retracement of the aforementioned range. If ETH/USD Bulls are able to push above this level, the 188.53 area will be closely observed as it represents the 23.6% retracement of the same range. Below current market activity, traders anticipate some buying pressure between the 176.60 – 178.40 range, with some additional technical Support possible around the 175.47 area. Above current market activity, traders anticipate some selling pressure around the 186.00 figure and 187.12 level.
Price activity is nearest the 200-bar MA (4-hourly) at 178.49 and the 200-bar MA (Hourly) at 183.46.
Technical Support is expected around 177.39/ 175.04/ 169.63 with Stops expected below.
Technical Resistance is expected around 191.40/ 193.41/ 199.50 with Stops expected above.
On 4-Hourly chart, SlowK is Bullishly above SlowD while MACD is Bullishly above MACDAverage.
On 60-minute chart, SlowK is Bearishly below SlowD while MACD is Bearishly below MACDAverage.
Investment Disclaimer