Published
4 years ago on
November 05, 2019
Bitcoin
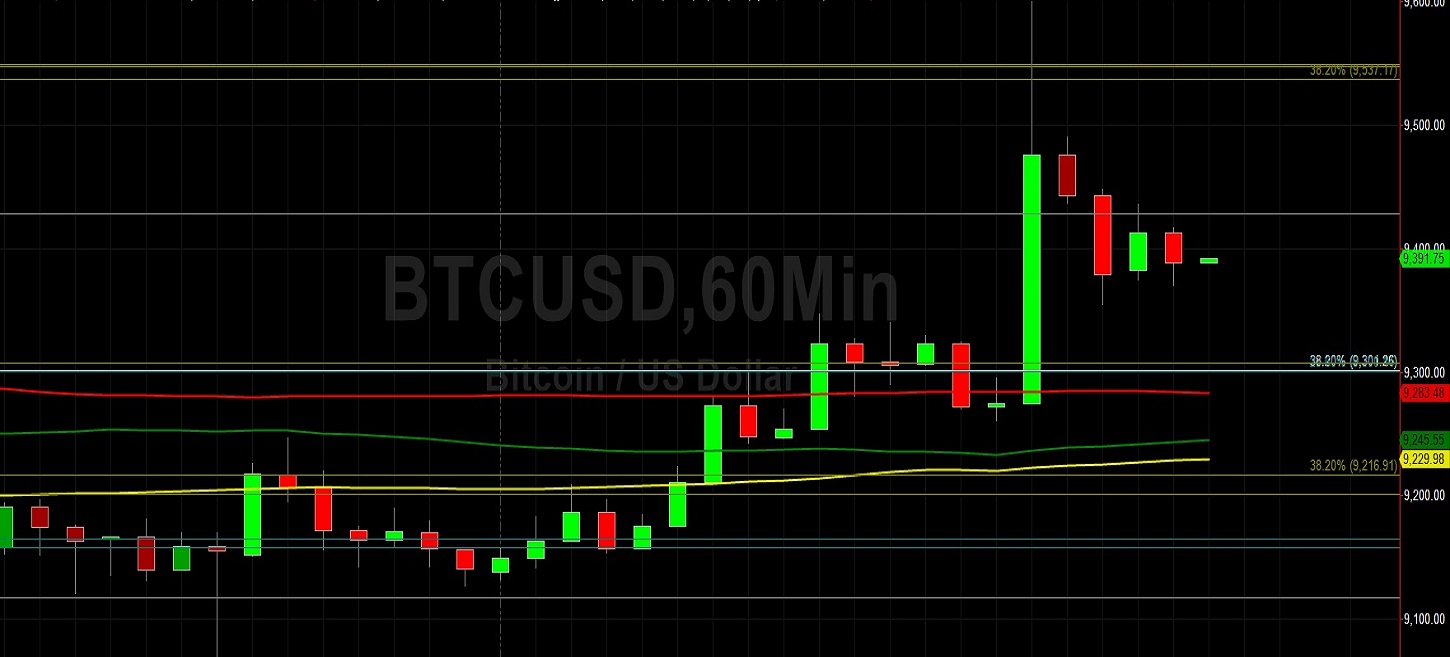
Bitcoin (BTC/USD) came off to the 9355.01 level early in today’s Asian session after the pair traded as high as the 9600.00 level during yesterday’s North American session, its strongest print since 28 October. Stops were elected above the 9547.75 area during the move higher, representing the 61.8% retracement of the 10939.34 – 7296.44 range. Price activity had been orbiting the the 9123.22 area, an important level that represents the 50% retracement of the 10944.67 – 7301.77 range. During Sunday’s European session, the pair declined below the 9301.26 area, another important level that represents the 38.2% retracement of the 7296.44 – 10540.49 range. The move lower also coincided with a decline and several closes below the 50-bar MA (4-hourly), its first close below this indicator since 25 October.
BTC/USD is back trading above its 200-bar MA (hourly), 50-bar MA (hourly), and 100-bar MA (hourly), indications of improving sentiment and a strengthening market bias. Below current market activity, chartists are paying attention to the 8918.47 and 8535.67 areas, representing the 50% and 61.8% retracements of the aforementioned 7296.44 – 10540.49 range. Traders also expect some buying pressure could emerge around the 8947.18 area, representing the 76.4% retracement of the 7427.00 – 13868.44 range. Above current market activity, the 9774.89 is an important upside level, representing the 23.6% retracement of the 7296.44 – 10540.49 range.
Price activity is nearest the 50-bar MA (4-hourly) at 9,273.68 and the 200-bar MA (Hourly) at 9,284.25.
Technical Support is expected around 8918.47/ 8535.67/ 8062.04 with Stops expected below.
Technical Resistance is expected around 9774.89/ 10540.49/ 10939.34 with Stops expected above.
On 4-Hourly chart, SlowK is Bullishly above SlowD while MACD is Bullishly above MACDAverage.
On 60-minute chart, SlowK is Bearishly below SlowD while MACD is Bullishly above MACDAverage.
Ethereum
Ethereum (ETH/USD) depreciated early in today’s Asian session as the pair weakened to the 185.34 area after being capped around the 189.50 area during yesterday’s North American session. Stops were elected above the 188.41 area during the pair’s ascent, representing the 50% retracement of the move from 224.71 to 152.11. After settling back, the pair is trading above the 183.33 level, an important technical area that represents the 23.6% retracement of the 515.88 – 80.60 range. Price activity around the 183.65 area is also being observed by chartists as it represents the 38.2% retracement of the of recent depreciation from 199.50 to 173.86. During yesterday’s move, the 186.68 level was absorbed, representing the 50% retracement of the aforementioned range, but traded did not have the strength to test the 189.71 and 193.45 areas, representing the 61.8% and 76.4% retracements.
If ETH/USD is Given, the 179.91 area represents the 23.6% retracement of that range. Chartists are also noting that price activity gained ground during yesterday’s European session up to the 183.43 area and tested the 200-bar MA (hourly) before moving back below 183.00, underscoring the importance of this indicator as technical Resistance. At around the same time, the 50-bar MA (4-hourly) was indicating around the 183.37 level, another reason why traders met with additional selling pressure around that area. Some chartists expect a pullback ahead of the 191.40 area, representing the 50% retracement of the 302.20 – 80.60 range.
Price activity is nearest the 50-bar MA (4-hourly) at 183.70 and the 200-bar MA (Hourly) at 183.82.
Technical Support is expected around 177.39/ 175.04/ 169.63 with Stops expected below.
Technical Resistance is expected around 191.40/ 193.41/ 199.50 with Stops expected above.
On 4-Hourly chart, SlowK is Bearishly below SlowD while MACD is Bullishly above MACDAverage.
On 60-minute chart, SlowK is Bearishly below SlowD while MACD is Bearishly below MACDAverage.
Investment Disclaimer