Published
4 years ago on
December 04, 2019
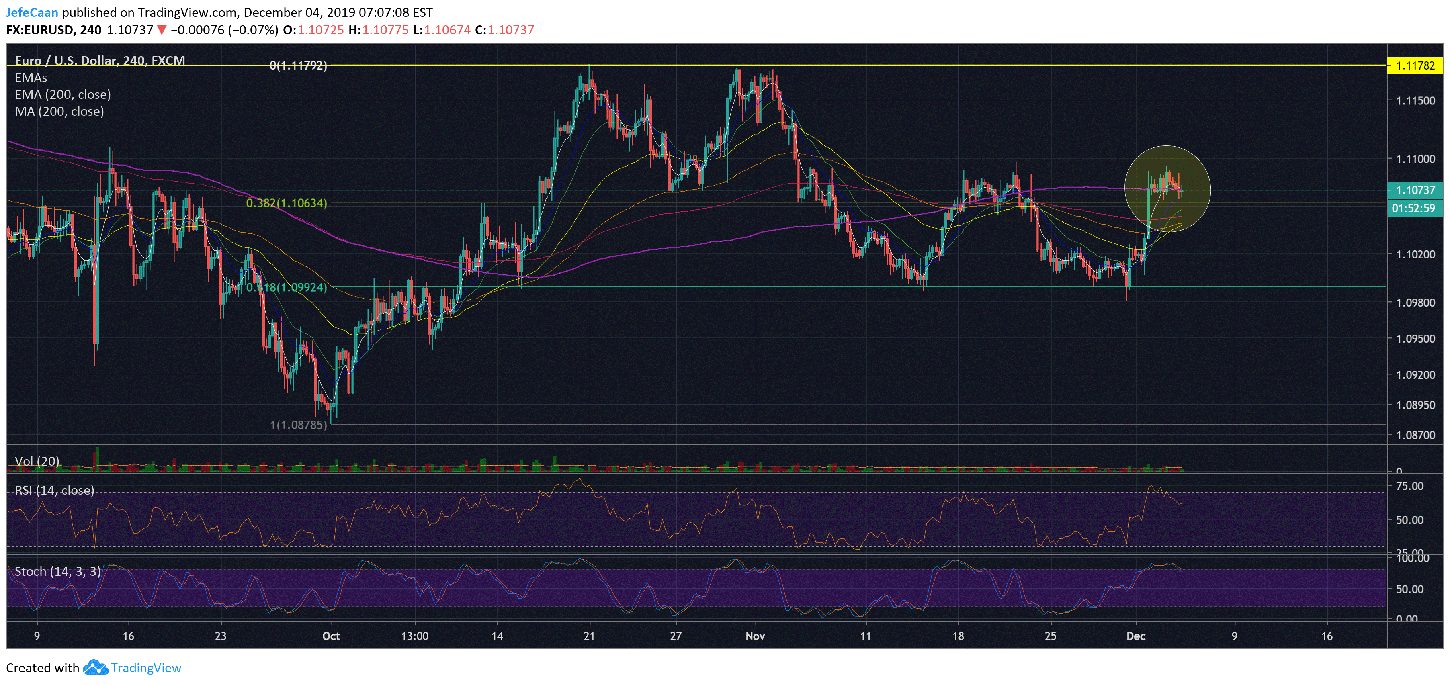
Bitcoin recently declined below $7,200 which made retail traders fearful once again. The Fear and Greed Index is once again flashing “Extreme fear”. The 4H chart for EUR/USD hints that all of that might soon change as the pair is now ready to rally higher past the 200 moving average. This would be a very bullish development for the cryptocurrency market as a decline in the strength of the US Dollar means higher cryptocurrency prices in terms of US Dollar. The EUR/USD forex pair could rally all the way towards the previous top of 1.11782 before the next decisive move. A move like that could definitely push Bitcoin (BTC) past the $8,000 mark.

The near-term outlook of the EUR/USD forex could lead to a pump in the price of Bitcoin potentially within the next 48 hours. That is because the pair has already broken above the 200 moving average on the 4H time frame which means that it is now ready to rally to potentially make a triple top. RSI on the 4H time frame shows that there is plenty of room for such a move. At a point when everyone is all fearful and the bears are more confident, it makes sense to expect a move that would catch most traders off guard. The bulls would miss out on an opportunity while the bears would end up losing trying to short the market when there is already plenty of fear in the market.
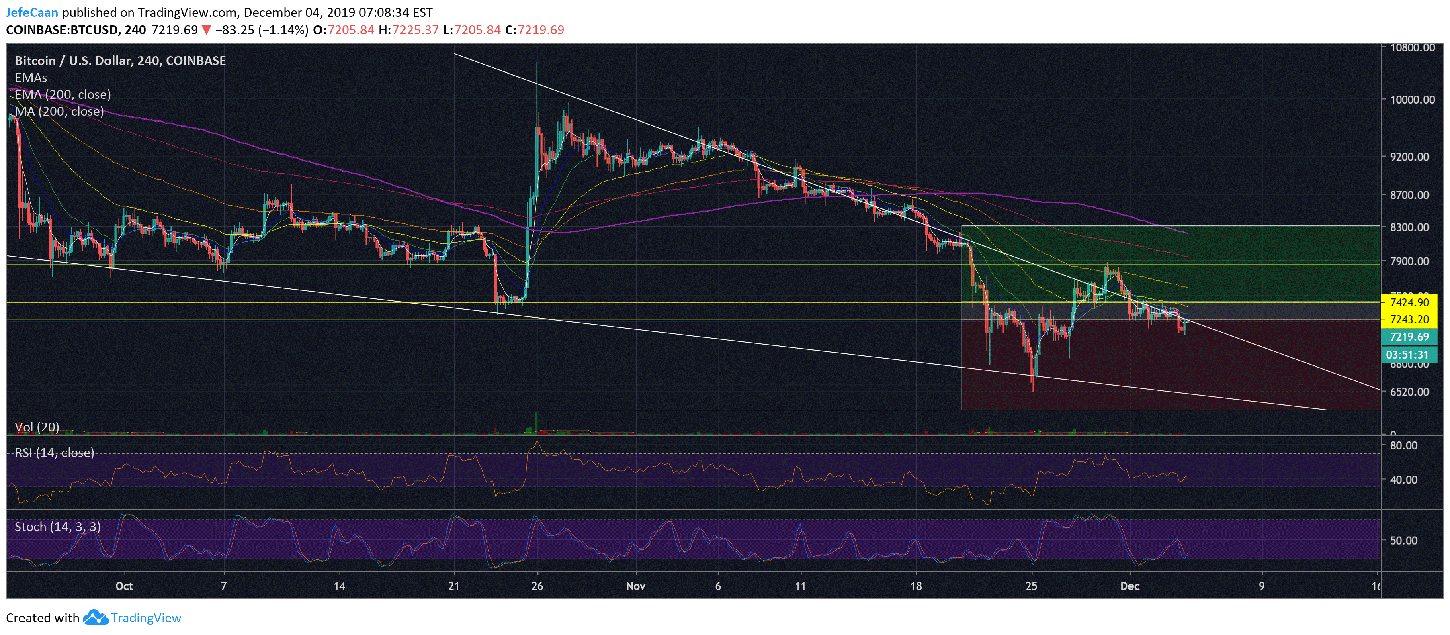
The 4H chart for BTC/USD shows that Bitcoin (BTC) could attempt a break out of the falling wedge despite the temporary bearishness. The price would be in the clear to rally towards $8,300 or higher if it ends up entering the green territory. The fact that BTC/USD did not fall aggressively after it entered the red territory tells us that the market makers and the whales are not on the side of retail bears. There is a strong probability that the price might end up entering the green territory in the near future and rally towards the 200 moving average on the 4H time frame.
The falling wedge that we see on this chart has to be broken sooner or later. If it breaks now, the price could soon rally towards $8,000 to potentially test the previously broken market structure. If it faces a rejection there, then we could be looking at a decline back within the large descending channel. It is important to note that despite any temporary bullishness in the market, there is a very high probability that we will see a decline down to the 200 Week MA which will drag the price below $6,000 and eventually below $3,000 depending on market conditions around the time.
Investment Disclaimer


